MurphyUsa MUSA full analysis,charts,indicators,moving averages,SMA,DMA,EMA,ADX,MACD,RSIMurphy Usa MUSA WideScreen charts, DMA,SMA,EMA technical analysis, forecast prediction, by indicators ADX,MACD,RSI,CCI USA stock exchange
operates under Consumer Durables sector & deals in Automotive Aftermarket
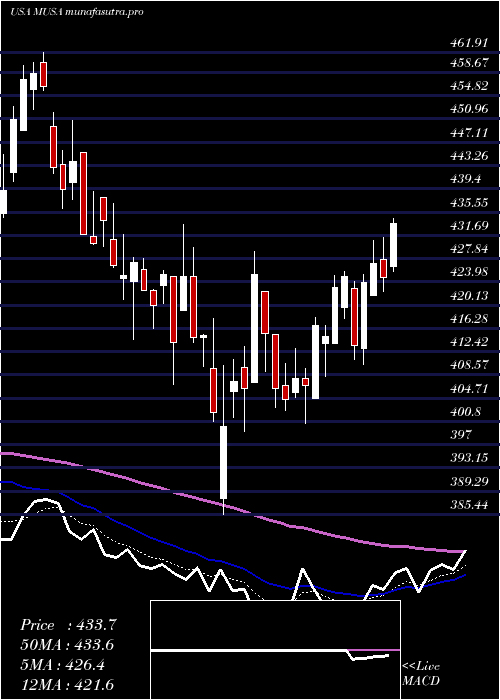
Daily price and charts and targets MurphyUsa Strong Daily Stock price targets for MurphyUsa MUSA are 353.04 and 381.41 | Daily Target 1 | 346.57 | | Daily Target 2 | 359.5 | | Daily Target 3 | 374.93666666667 | | Daily Target 4 | 387.87 | | Daily Target 5 | 403.31 |
Daily price and volume Murphy Usa
| Date |
Closing |
Open |
Range |
Volume |
Mon 20 October 2025 |
372.44 (-3.83%) |
382.64 |
362.00 - 390.37 |
1.5916 times |
Fri 17 October 2025 |
387.28 (2.03%) |
382.72 |
380.74 - 390.39 |
0.9828 times |
Thu 16 October 2025 |
379.57 (0.48%) |
378.29 |
376.48 - 382.22 |
0.8626 times |
Wed 15 October 2025 |
377.75 (-0.48%) |
374.59 |
374.59 - 387.03 |
1.5409 times |
Tue 14 October 2025 |
379.57 (0.97%) |
377.67 |
375.63 - 386.88 |
1.6049 times |
Mon 13 October 2025 |
375.91 (-1.63%) |
379.49 |
374.15 - 384.36 |
1.1876 times |
Tue 07 October 2025 |
382.15 (0.61%) |
380.48 |
375.22 - 382.33 |
0.7411 times |
Mon 06 October 2025 |
379.84 (-3.95%) |
396.00 |
375.47 - 396.13 |
0.4298 times |
Fri 03 October 2025 |
395.46 (0.17%) |
393.99 |
393.74 - 397.75 |
0.7887 times |
Thu 02 October 2025 |
394.77 (0.04%) |
394.00 |
391.28 - 397.50 |
0.27 times |
Wed 01 October 2025 |
394.60 (1.63%) |
388.72 |
387.50 - 397.52 |
1.0682 times |
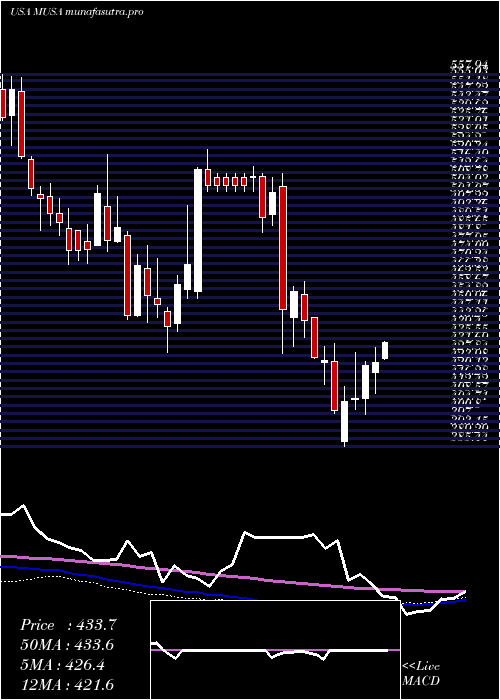
Weekly price and charts MurphyUsa Strong weekly Stock price targets for MurphyUsa MUSA are 353.04 and 381.41 | Weekly Target 1 | 346.57 | | Weekly Target 2 | 359.5 | | Weekly Target 3 | 374.93666666667 | | Weekly Target 4 | 387.87 | | Weekly Target 5 | 403.31 |
Weekly price and volumes for Murphy Usa
| Date |
Closing |
Open |
Range |
Volume |
Mon 20 October 2025 |
372.44 (-3.83%) |
382.64 |
362.00 - 390.37 |
0.3451 times |
Fri 17 October 2025 |
387.28 (1.34%) |
379.49 |
374.15 - 390.39 |
1.3398 times |
Tue 07 October 2025 |
382.15 (-3.37%) |
396.00 |
375.22 - 396.13 |
0.2539 times |
Fri 03 October 2025 |
395.46 (0.77%) |
391.76 |
384.93 - 397.75 |
1.0027 times |
Fri 26 September 2025 |
392.43 (2.47%) |
386.10 |
379.02 - 399.31 |
1.0799 times |
Fri 19 September 2025 |
382.98 (-1.85%) |
390.51 |
377.73 - 409.91 |
1.9333 times |
Fri 12 September 2025 |
390.19 (0.73%) |
385.71 |
373.38 - 395.40 |
1.5138 times |
Fri 05 September 2025 |
387.35 (2.88%) |
375.90 |
368.49 - 387.60 |
0.9773 times |
Fri 29 August 2025 |
376.50 (0%) |
376.31 |
371.75 - 377.31 |
0.2039 times |
Fri 29 August 2025 |
376.50 (-0.55%) |
375.18 |
369.27 - 383.33 |
1.3502 times |
Fri 22 August 2025 |
378.57 (-3.84%) |
393.10 |
374.78 - 404.25 |
1.2211 times |
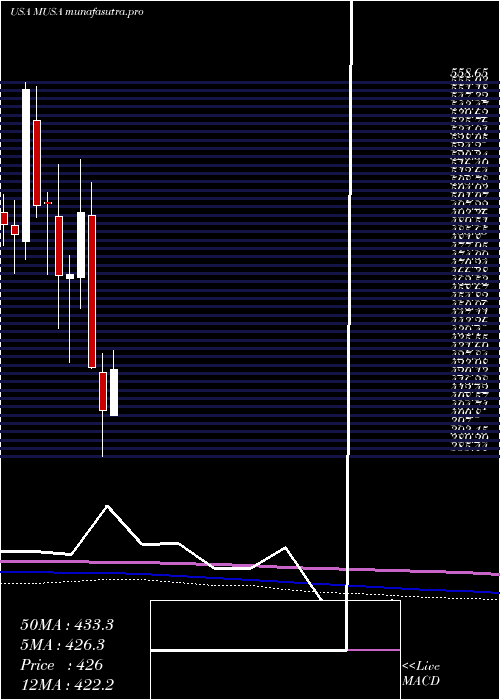
Monthly price and charts MurphyUsa Strong monthly Stock price targets for MurphyUsa MUSA are 349.35 and 385.1 | Monthly Target 1 | 341.65 | | Monthly Target 2 | 357.04 | | Monthly Target 3 | 377.39666666667 | | Monthly Target 4 | 392.79 | | Monthly Target 5 | 413.15 |
Monthly price and volumes Murphy Usa
| Date |
Closing |
Open |
Range |
Volume |
Mon 20 October 2025 |
372.44 (-4.07%) |
388.72 |
362.00 - 397.75 |
0.4546 times |
Tue 30 September 2025 |
388.26 (3.12%) |
375.90 |
368.49 - 409.91 |
1.1452 times |
Fri 29 August 2025 |
376.50 (3.87%) |
353.53 |
345.23 - 404.25 |
1.1144 times |
Thu 31 July 2025 |
362.48 (-10.89%) |
404.68 |
357.23 - 438.00 |
1.2234 times |
Mon 30 June 2025 |
406.80 (-4.68%) |
424.51 |
385.44 - 433.47 |
1.1871 times |
Fri 30 May 2025 |
426.79 (-14.4%) |
496.96 |
426.41 - 512.22 |
1.4459 times |
Wed 30 April 2025 |
498.57 (6.12%) |
468.62 |
453.98 - 523.09 |
0.9067 times |
Mon 31 March 2025 |
469.81 (0.12%) |
468.09 |
429.18 - 478.78 |
0.9197 times |
Fri 28 February 2025 |
469.24 (-6.7%) |
496.77 |
444.63 - 520.85 |
0.8868 times |
Fri 31 January 2025 |
502.91 (0.23%) |
503.00 |
469.67 - 507.55 |
0.7161 times |
Tue 31 December 2024 |
501.75 (-9.67%) |
541.00 |
496.36 - 556.86 |
0.4567 times |
DMA SMA EMA moving averages of Murphy Usa MUSA
DMA (daily moving average) of Murphy Usa MUSA
| DMA period | DMA value | | 5 day DMA | 379.32 | | 12 day DMA | 383.97 | | 20 day DMA | 385.5 | | 35 day DMA | 385.11 | | 50 day DMA | 384.97 | | 100 day DMA | 400.41 | | 150 day DMA | 425.87 | | 200 day DMA | 439.67 | EMA (exponential moving average) of Murphy Usa MUSA
| EMA period | EMA current | EMA prev | EMA prev2 | | 5 day EMA | 379.19 | 382.57 | 380.21 | | 12 day EMA | 382.33 | 384.13 | 383.56 | | 20 day EMA | 383.89 | 385.1 | 384.87 | | 35 day EMA | 383.9 | 384.57 | 384.41 | | 50 day EMA | 383.37 | 383.82 | 383.68 |
SMA (simple moving average) of Murphy Usa MUSA
| SMA period | SMA current | SMA prev | SMA prev2 | | 5 day SMA | 379.32 | 380.02 | 378.99 | | 12 day SMA | 383.97 | 385.59 | 386.02 | | 20 day SMA | 385.5 | 386.77 | 387.39 | | 35 day SMA | 385.11 | 385.28 | 385.01 | | 50 day SMA | 384.97 | 384.87 | 384.36 | | 100 day SMA | 400.41 | 401.12 | 401.81 | | 150 day SMA | 425.87 | 426.37 | 426.8 | | 200 day SMA | 439.67 | 440.32 | 440.88 |
|
|
