MurphyOil MUR full analysis,charts,indicators,moving averages,SMA,DMA,EMA,ADX,MACD,RSIMurphy Oil MUR WideScreen charts, DMA,SMA,EMA technical analysis, forecast prediction, by indicators ADX,MACD,RSI,CCI USA stock exchange
operates under Energy sector & deals in Oil Gas Production
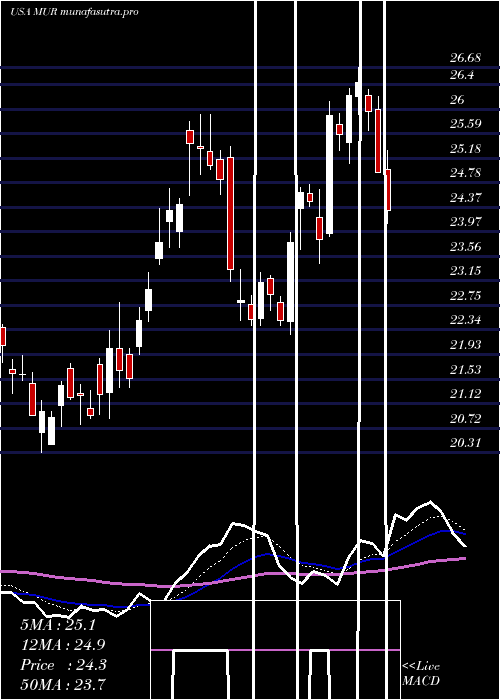
Daily price and charts and targets MurphyOil Strong Daily Stock price targets for MurphyOil MUR are 32.51 and 33.41 | Daily Target 1 | 31.82 | | Daily Target 2 | 32.29 | | Daily Target 3 | 32.723333333333 | | Daily Target 4 | 33.19 | | Daily Target 5 | 33.62 |
Daily price and volume Murphy Oil
| Date |
Closing |
Open |
Range |
Volume |
Fri 05 December 2025 |
32.75 (0.77%) |
32.48 |
32.26 - 33.16 |
0.7975 times |
Thu 04 December 2025 |
32.50 (-1.4%) |
32.85 |
32.44 - 33.15 |
0.9066 times |
Wed 03 December 2025 |
32.96 (4.8%) |
31.82 |
31.73 - 33.02 |
1.0602 times |
Tue 02 December 2025 |
31.45 (-0.38%) |
31.50 |
31.04 - 31.71 |
0.5866 times |
Mon 01 December 2025 |
31.57 (-1.56%) |
31.96 |
31.54 - 32.78 |
1.6116 times |
Fri 28 November 2025 |
32.07 (1.97%) |
31.50 |
31.23 - 32.11 |
0.4792 times |
Wed 26 November 2025 |
31.45 (0.96%) |
30.86 |
30.86 - 31.82 |
0.8146 times |
Tue 25 November 2025 |
31.15 (0%) |
30.70 |
30.21 - 31.19 |
0.8913 times |
Mon 24 November 2025 |
31.15 (1.5%) |
30.35 |
29.73 - 31.23 |
1.186 times |
Fri 21 November 2025 |
30.69 (1.96%) |
29.98 |
29.68 - 30.82 |
1.6665 times |
Thu 20 November 2025 |
30.10 (-0.92%) |
30.39 |
30.03 - 31.69 |
1.6506 times |
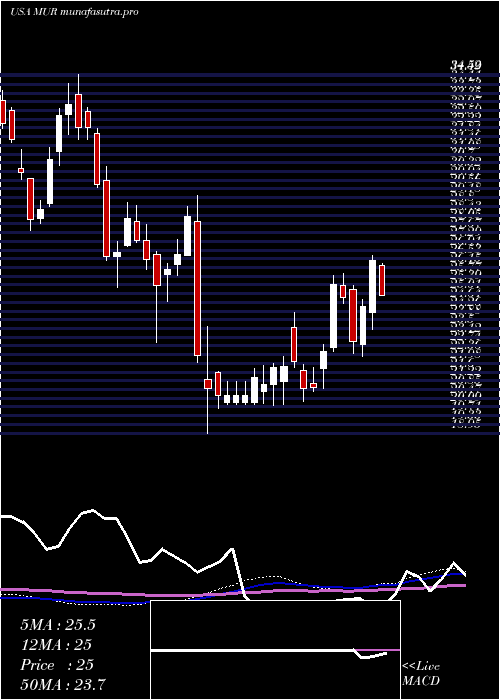
Weekly price and charts MurphyOil Strong weekly Stock price targets for MurphyOil MUR are 31.9 and 34.02 | Weekly Target 1 | 30.2 | | Weekly Target 2 | 31.47 | | Weekly Target 3 | 32.316666666667 | | Weekly Target 4 | 33.59 | | Weekly Target 5 | 34.44 |
Weekly price and volumes for Murphy Oil
| Date |
Closing |
Open |
Range |
Volume |
Fri 05 December 2025 |
32.75 (2.12%) |
31.96 |
31.04 - 33.16 |
1.1145 times |
Fri 28 November 2025 |
32.07 (4.5%) |
30.35 |
29.73 - 32.11 |
0.7571 times |
Fri 21 November 2025 |
30.69 (0.76%) |
30.04 |
28.94 - 31.69 |
1.549 times |
Fri 14 November 2025 |
30.46 (7.14%) |
28.74 |
27.66 - 30.52 |
1.5777 times |
Fri 07 November 2025 |
28.43 (0.46%) |
27.17 |
26.49 - 28.95 |
0.9728 times |
Fri 31 October 2025 |
28.30 (0%) |
28.74 |
27.89 - 28.79 |
0.1809 times |
Fri 31 October 2025 |
28.30 (-2.18%) |
29.37 |
27.54 - 29.51 |
0.8305 times |
Fri 24 October 2025 |
28.93 (3.8%) |
28.16 |
26.89 - 29.93 |
1.0936 times |
Fri 17 October 2025 |
27.87 (-7.38%) |
27.59 |
26.88 - 29.00 |
1.358 times |
Tue 07 October 2025 |
30.09 (-1.18%) |
30.97 |
29.30 - 31.39 |
0.5658 times |
Fri 03 October 2025 |
30.45 (1.4%) |
29.64 |
27.96 - 30.51 |
1.3191 times |
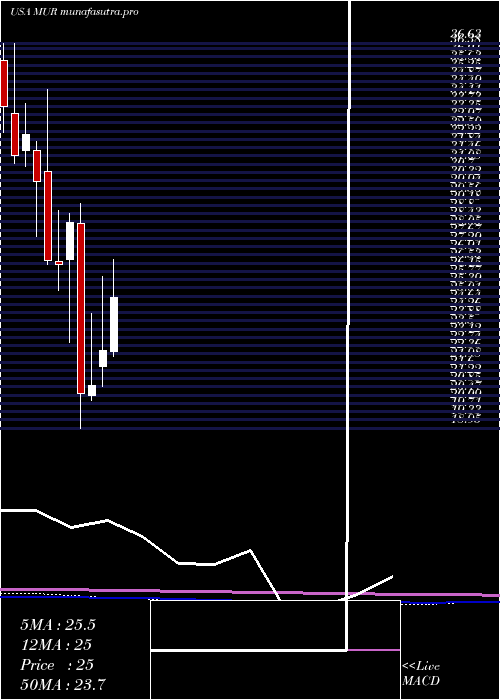
Monthly price and charts MurphyOil Strong monthly Stock price targets for MurphyOil MUR are 31.9 and 34.02 | Monthly Target 1 | 30.2 | | Monthly Target 2 | 31.47 | | Monthly Target 3 | 32.316666666667 | | Monthly Target 4 | 33.59 | | Monthly Target 5 | 34.44 |
Monthly price and volumes Murphy Oil
| Date |
Closing |
Open |
Range |
Volume |
Fri 05 December 2025 |
32.75 (2.12%) |
31.96 |
31.04 - 33.16 |
0.1812 times |
Fri 28 November 2025 |
32.07 (13.32%) |
27.17 |
26.49 - 32.11 |
0.7898 times |
Fri 31 October 2025 |
28.30 (-0.39%) |
28.41 |
26.88 - 31.39 |
0.779 times |
Tue 30 September 2025 |
28.41 (14.28%) |
24.88 |
24.49 - 30.49 |
1.0711 times |
Fri 29 August 2025 |
24.86 (0.2%) |
24.48 |
21.86 - 25.16 |
0.9654 times |
Thu 31 July 2025 |
24.81 (10.27%) |
22.48 |
22.26 - 27.20 |
0.9646 times |
Mon 30 June 2025 |
22.50 (7.5%) |
21.77 |
20.87 - 25.91 |
1.1934 times |
Fri 30 May 2025 |
20.93 (1.95%) |
20.44 |
20.20 - 24.20 |
1.2019 times |
Wed 30 April 2025 |
20.53 (-27.71%) |
28.34 |
18.95 - 29.26 |
1.4226 times |
Mon 31 March 2025 |
28.40 (7.21%) |
26.71 |
22.90 - 28.82 |
1.4309 times |
Fri 28 February 2025 |
26.49 (-0.53%) |
26.62 |
25.26 - 28.97 |
1.1169 times |
DMA SMA EMA moving averages of Murphy Oil MUR
DMA (daily moving average) of Murphy Oil MUR
| DMA period | DMA value | | 5 day DMA | 32.25 | | 12 day DMA | 31.52 | | 20 day DMA | 30.7 | | 35 day DMA | 29.52 | | 50 day DMA | 29.38 | | 100 day DMA | 27.1 | | 150 day DMA | 25.66 | | 200 day DMA | 25.36 | EMA (exponential moving average) of Murphy Oil MUR
| EMA period | EMA current | EMA prev | EMA prev2 | | 5 day EMA | 32.34 | 32.13 | 31.94 | | 12 day EMA | 31.58 | 31.37 | 31.16 | | 20 day EMA | 30.92 | 30.73 | 30.54 | | 35 day EMA | 30.19 | 30.04 | 29.9 | | 50 day EMA | 29.48 | 29.35 | 29.22 |
SMA (simple moving average) of Murphy Oil MUR
| SMA period | SMA current | SMA prev | SMA prev2 | | 5 day SMA | 32.25 | 32.11 | 31.9 | | 12 day SMA | 31.52 | 31.33 | 31.08 | | 20 day SMA | 30.7 | 30.46 | 30.17 | | 35 day SMA | 29.52 | 29.36 | 29.23 | | 50 day SMA | 29.38 | 29.26 | 29.15 | | 100 day SMA | 27.1 | 27.04 | 26.98 | | 150 day SMA | 25.66 | 25.58 | 25.51 | | 200 day SMA | 25.36 | 25.34 | 25.32 |
|
|
