BlackrockMuniholdings MUJ full analysis,charts,indicators,moving averages,SMA,DMA,EMA,ADX,MACD,RSIBlackrock Muniholdings MUJ WideScreen charts, DMA,SMA,EMA technical analysis, forecast prediction, by indicators ADX,MACD,RSI,CCI USA stock exchange
operates under N A sector & deals in N A
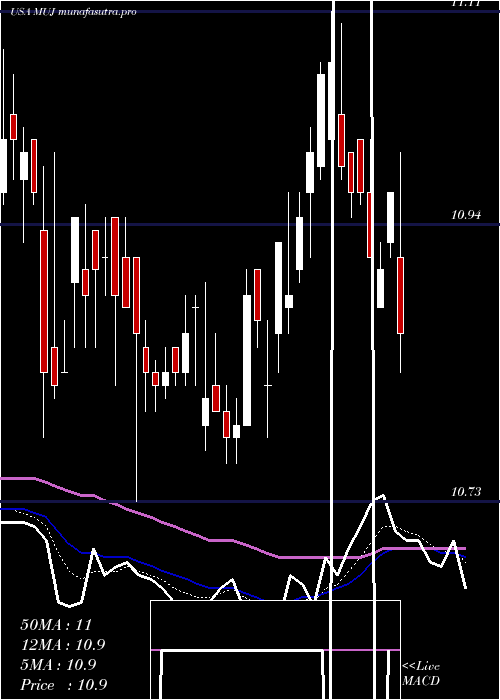
Daily price and charts and targets BlackrockMuniholdings Strong Daily Stock price targets for BlackrockMuniholdings MUJ are 11.47 and 11.54 | Daily Target 1 | 11.46 | | Daily Target 2 | 11.48 | | Daily Target 3 | 11.526666666667 | | Daily Target 4 | 11.55 | | Daily Target 5 | 11.6 |
Daily price and volume Blackrock Muniholdings
| Date |
Closing |
Open |
Range |
Volume |
Fri 17 October 2025 |
11.51 (-0.52%) |
11.57 |
11.50 - 11.57 |
0.8951 times |
Thu 16 October 2025 |
11.57 (-0.52%) |
11.67 |
11.54 - 11.68 |
0.8501 times |
Wed 15 October 2025 |
11.63 (-0.26%) |
11.66 |
11.62 - 11.66 |
0.4022 times |
Tue 14 October 2025 |
11.66 (-0.17%) |
11.71 |
11.63 - 11.71 |
1.0251 times |
Mon 13 October 2025 |
11.68 (0.26%) |
11.65 |
11.60 - 11.70 |
0.7303 times |
Tue 07 October 2025 |
11.65 (0.95%) |
11.57 |
11.55 - 11.67 |
1.2697 times |
Mon 06 October 2025 |
11.54 (-0.86%) |
11.55 |
11.52 - 11.62 |
0.9849 times |
Fri 03 October 2025 |
11.64 (-0.26%) |
11.67 |
11.51 - 11.67 |
1.1732 times |
Thu 02 October 2025 |
11.67 (0.43%) |
11.67 |
11.59 - 11.69 |
0.7897 times |
Wed 01 October 2025 |
11.62 (0.26%) |
11.59 |
11.49 - 11.69 |
1.8796 times |
Tue 30 September 2025 |
11.59 (1.31%) |
11.48 |
11.46 - 11.59 |
0.6577 times |
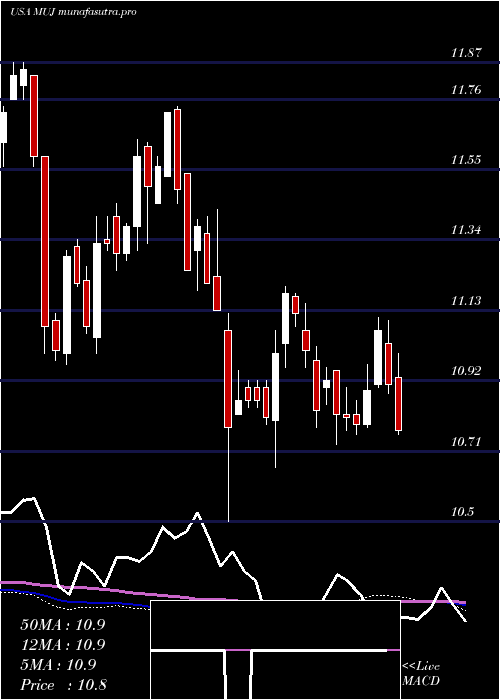
Weekly price and charts BlackrockMuniholdings Strong weekly Stock price targets for BlackrockMuniholdings MUJ are 11.4 and 11.61 | Weekly Target 1 | 11.36 | | Weekly Target 2 | 11.44 | | Weekly Target 3 | 11.573333333333 | | Weekly Target 4 | 11.65 | | Weekly Target 5 | 11.78 |
Weekly price and volumes for Blackrock Muniholdings
| Date |
Closing |
Open |
Range |
Volume |
Fri 17 October 2025 |
11.51 (-1.2%) |
11.65 |
11.50 - 11.71 |
0.9765 times |
Tue 07 October 2025 |
11.65 (0.09%) |
11.55 |
11.52 - 11.67 |
0.5641 times |
Fri 03 October 2025 |
11.64 (1.57%) |
11.42 |
11.42 - 11.69 |
1.2271 times |
Fri 26 September 2025 |
11.46 (0.53%) |
11.40 |
11.31 - 11.51 |
1.1348 times |
Fri 19 September 2025 |
11.40 (-0.09%) |
11.37 |
11.36 - 11.49 |
0.922 times |
Fri 12 September 2025 |
11.41 (2.98%) |
11.14 |
11.13 - 11.49 |
1.3186 times |
Fri 05 September 2025 |
11.08 (0.18%) |
11.04 |
10.88 - 11.08 |
1.8519 times |
Fri 29 August 2025 |
11.06 (0%) |
11.06 |
11.03 - 11.07 |
0.2205 times |
Fri 29 August 2025 |
11.06 (0.36%) |
11.05 |
10.96 - 11.11 |
0.9964 times |
Fri 22 August 2025 |
11.02 (-0.36%) |
11.06 |
10.85 - 11.07 |
0.7881 times |
Fri 15 August 2025 |
11.06 (1%) |
10.98 |
10.94 - 11.13 |
0.7845 times |
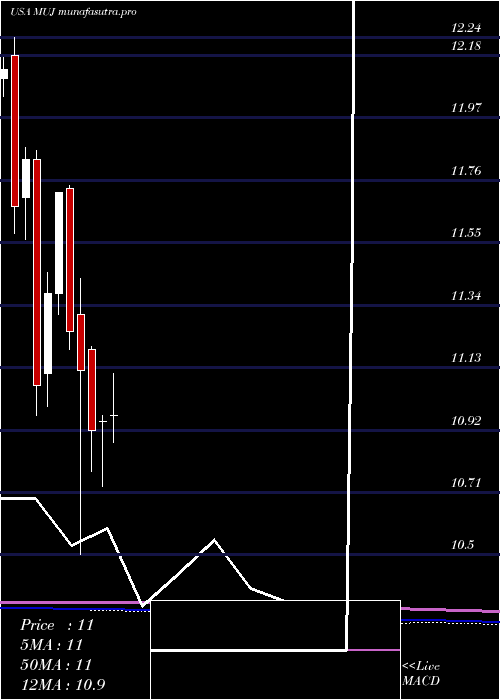
Monthly price and charts BlackrockMuniholdings Strong monthly Stock price targets for BlackrockMuniholdings MUJ are 11.39 and 11.61 | Monthly Target 1 | 11.35 | | Monthly Target 2 | 11.43 | | Monthly Target 3 | 11.57 | | Monthly Target 4 | 11.65 | | Monthly Target 5 | 11.79 |
Monthly price and volumes Blackrock Muniholdings
| Date |
Closing |
Open |
Range |
Volume |
Fri 17 October 2025 |
11.51 (-0.69%) |
11.59 |
11.49 - 11.71 |
0.6352 times |
Tue 30 September 2025 |
11.59 (4.79%) |
11.04 |
10.88 - 11.59 |
1.3946 times |
Fri 29 August 2025 |
11.06 (2.22%) |
10.83 |
10.81 - 11.13 |
0.9766 times |
Thu 31 July 2025 |
10.82 (-1.19%) |
10.97 |
10.66 - 11.11 |
1.2566 times |
Mon 30 June 2025 |
10.95 (0.27%) |
10.95 |
10.73 - 10.97 |
1.0127 times |
Fri 30 May 2025 |
10.92 (-1.8%) |
11.19 |
10.78 - 11.20 |
0.907 times |
Wed 30 April 2025 |
11.12 (-1.16%) |
11.31 |
10.50 - 11.43 |
1.2785 times |
Mon 31 March 2025 |
11.25 (-4.01%) |
11.73 |
11.19 - 11.74 |
0.6683 times |
Fri 28 February 2025 |
11.72 (2.99%) |
11.38 |
11.31 - 11.72 |
0.7691 times |
Fri 31 January 2025 |
11.38 (2.8%) |
11.11 |
11.00 - 11.45 |
1.1015 times |
Tue 31 December 2024 |
11.07 (-6.42%) |
11.83 |
10.97 - 11.86 |
2.0347 times |
DMA SMA EMA moving averages of Blackrock Muniholdings MUJ
DMA (daily moving average) of Blackrock Muniholdings MUJ
| DMA period | DMA value | | 5 day DMA | 11.61 | | 12 day DMA | 11.6 | | 20 day DMA | 11.53 | | 35 day DMA | 11.39 | | 50 day DMA | 11.27 | | 100 day DMA | 11.06 | | 150 day DMA | 11.07 | | 200 day DMA | 11.15 | EMA (exponential moving average) of Blackrock Muniholdings MUJ
| EMA period | EMA current | EMA prev | EMA prev2 | | 5 day EMA | 11.58 | 11.62 | 11.64 | | 12 day EMA | 11.57 | 11.58 | 11.58 | | 20 day EMA | 11.52 | 11.52 | 11.51 | | 35 day EMA | 11.4 | 11.39 | 11.38 | | 50 day EMA | 11.27 | 11.26 | 11.25 |
SMA (simple moving average) of Blackrock Muniholdings MUJ
| SMA period | SMA current | SMA prev | SMA prev2 | | 5 day SMA | 11.61 | 11.64 | 11.63 | | 12 day SMA | 11.6 | 11.6 | 11.58 | | 20 day SMA | 11.53 | 11.53 | 11.52 | | 35 day SMA | 11.39 | 11.37 | 11.36 | | 50 day SMA | 11.27 | 11.26 | 11.24 | | 100 day SMA | 11.06 | 11.06 | 11.05 | | 150 day SMA | 11.07 | 11.07 | 11.07 | | 200 day SMA | 11.15 | 11.15 | 11.14 |
|
|
