BlackrockMuniholdings MUE full analysis,charts,indicators,moving averages,SMA,DMA,EMA,ADX,MACD,RSIBlackrock Muniholdings MUE WideScreen charts, DMA,SMA,EMA technical analysis, forecast prediction, by indicators ADX,MACD,RSI,CCI USA stock exchange
operates under N A sector & deals in N A
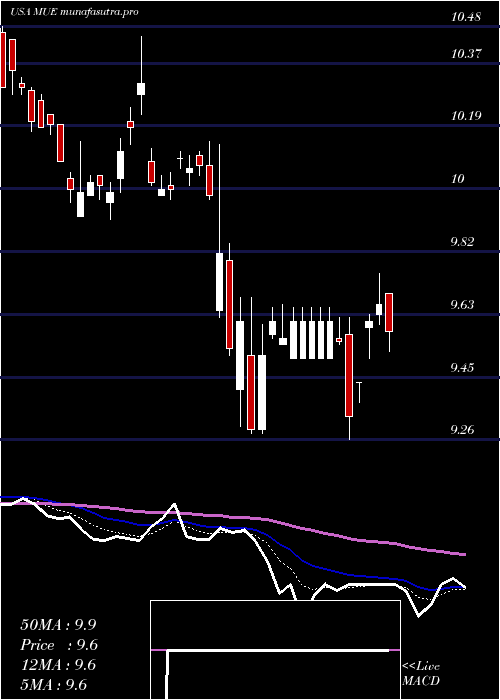
Daily price and charts and targets BlackrockMuniholdings Strong Daily Stock price targets for BlackrockMuniholdings MUE are 10.02 and 10.09 | Daily Target 1 | 10.01 | | Daily Target 2 | 10.03 | | Daily Target 3 | 10.076666666667 | | Daily Target 4 | 10.1 | | Daily Target 5 | 10.15 |
Daily price and volume Blackrock Muniholdings
| Date |
Closing |
Open |
Range |
Volume |
Mon 20 October 2025 |
10.06 (-0.2%) |
10.09 |
10.05 - 10.12 |
1.1716 times |
Fri 17 October 2025 |
10.08 (0%) |
10.05 |
10.00 - 10.08 |
0.565 times |
Thu 16 October 2025 |
10.08 (0.1%) |
10.10 |
10.05 - 10.11 |
1.3467 times |
Wed 15 October 2025 |
10.07 (-0.4%) |
10.04 |
10.00 - 10.11 |
0.8368 times |
Tue 14 October 2025 |
10.11 (0.1%) |
10.08 |
10.07 - 10.12 |
1.0149 times |
Mon 13 October 2025 |
10.10 (1%) |
10.06 |
10.03 - 10.10 |
0.6414 times |
Tue 07 October 2025 |
10.00 (0.3%) |
9.95 |
9.93 - 10.02 |
0.5031 times |
Mon 06 October 2025 |
9.97 (0.1%) |
9.96 |
9.87 - 9.97 |
2.6713 times |
Fri 03 October 2025 |
9.96 (-0.8%) |
10.01 |
9.95 - 10.03 |
0.9829 times |
Thu 02 October 2025 |
10.04 (-0.1%) |
10.03 |
10.03 - 10.08 |
0.2662 times |
Wed 01 October 2025 |
10.05 (-0.1%) |
10.06 |
10.03 - 10.13 |
0.5118 times |
Weekly price and charts BlackrockMuniholdings Strong weekly Stock price targets for BlackrockMuniholdings MUE are 10.02 and 10.09 | Weekly Target 1 | 10.01 | | Weekly Target 2 | 10.03 | | Weekly Target 3 | 10.076666666667 | | Weekly Target 4 | 10.1 | | Weekly Target 5 | 10.15 |
Weekly price and volumes for Blackrock Muniholdings
| Date |
Closing |
Open |
Range |
Volume |
Mon 20 October 2025 |
10.06 (-0.2%) |
10.09 |
10.05 - 10.12 |
0.4222 times |
Fri 17 October 2025 |
10.08 (0.8%) |
10.06 |
10.00 - 10.12 |
1.5872 times |
Tue 07 October 2025 |
10.00 (0.4%) |
9.96 |
9.87 - 10.02 |
1.1439 times |
Fri 03 October 2025 |
9.96 (-0.4%) |
10.05 |
9.95 - 10.13 |
0.942 times |
Fri 26 September 2025 |
10.00 (-0.4%) |
10.04 |
9.95 - 10.06 |
0.6421 times |
Fri 19 September 2025 |
10.04 (0.1%) |
10.03 |
9.96 - 10.11 |
0.8743 times |
Fri 12 September 2025 |
10.03 (3.4%) |
9.74 |
9.74 - 10.08 |
1.2613 times |
Fri 05 September 2025 |
9.70 (1.68%) |
9.50 |
9.45 - 9.70 |
1.1658 times |
Fri 29 August 2025 |
9.54 (0%) |
9.48 |
9.45 - 9.55 |
0.1788 times |
Fri 29 August 2025 |
9.54 (0.85%) |
9.51 |
9.40 - 9.55 |
1.7824 times |
Fri 22 August 2025 |
9.46 (-0.94%) |
9.55 |
9.37 - 9.56 |
1.5008 times |
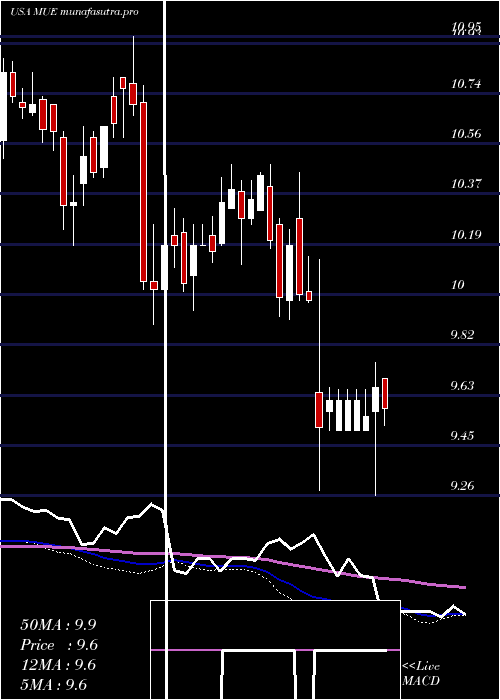
Monthly price and charts BlackrockMuniholdings Strong monthly Stock price targets for BlackrockMuniholdings MUE are 9.93 and 10.19 | Monthly Target 1 | 9.76 | | Monthly Target 2 | 9.91 | | Monthly Target 3 | 10.02 | | Monthly Target 4 | 10.17 | | Monthly Target 5 | 10.28 |
Monthly price and volumes Blackrock Muniholdings
| Date |
Closing |
Open |
Range |
Volume |
Mon 20 October 2025 |
10.06 (0%) |
10.06 |
9.87 - 10.13 |
0.8246 times |
Tue 30 September 2025 |
10.06 (5.45%) |
9.50 |
9.45 - 10.11 |
0.9254 times |
Fri 29 August 2025 |
9.54 (1.49%) |
9.43 |
9.37 - 9.64 |
1.3064 times |
Thu 31 July 2025 |
9.40 (-1.88%) |
9.63 |
9.27 - 9.65 |
1.0227 times |
Mon 30 June 2025 |
9.58 (0.42%) |
9.52 |
9.39 - 9.62 |
1.2128 times |
Fri 30 May 2025 |
9.54 (-2.15%) |
9.75 |
9.45 - 9.91 |
1.0709 times |
Wed 30 April 2025 |
9.75 (-2.5%) |
10.09 |
9.26 - 10.14 |
1.2573 times |
Mon 31 March 2025 |
10.00 (-4.21%) |
10.40 |
9.91 - 10.48 |
0.7335 times |
Fri 28 February 2025 |
10.44 (0.97%) |
10.32 |
10.11 - 10.48 |
0.7554 times |
Fri 31 January 2025 |
10.34 (3.4%) |
10.04 |
9.94 - 10.43 |
0.8909 times |
Tue 31 December 2024 |
10.00 (-5.93%) |
10.80 |
9.89 - 10.95 |
1.3921 times |

DMA SMA EMA moving averages of Blackrock Muniholdings MUE
DMA (daily moving average) of Blackrock Muniholdings MUE
| DMA period | DMA value | | 5 day DMA | 10.08 | | 12 day DMA | 10.05 | | 20 day DMA | 10.04 | | 35 day DMA | 9.92 | | 50 day DMA | 9.79 | | 100 day DMA | 9.64 | | 150 day DMA | 9.68 | | 200 day DMA | 9.82 | EMA (exponential moving average) of Blackrock Muniholdings MUE
| EMA period | EMA current | EMA prev | EMA prev2 | | 5 day EMA | 10.07 | 10.07 | 10.07 | | 12 day EMA | 10.05 | 10.05 | 10.05 | | 20 day EMA | 10.01 | 10 | 9.99 | | 35 day EMA | 9.9 | 9.89 | 9.88 | | 50 day EMA | 9.78 | 9.77 | 9.76 |
SMA (simple moving average) of Blackrock Muniholdings MUE
| SMA period | SMA current | SMA prev | SMA prev2 | | 5 day SMA | 10.08 | 10.09 | 10.07 | | 12 day SMA | 10.05 | 10.05 | 10.04 | | 20 day SMA | 10.04 | 10.04 | 10.03 | | 35 day SMA | 9.92 | 9.9 | 9.88 | | 50 day SMA | 9.79 | 9.78 | 9.77 | | 100 day SMA | 9.64 | 9.63 | 9.63 | | 150 day SMA | 9.68 | 9.68 | 9.68 | | 200 day SMA | 9.82 | 9.82 | 9.82 |
|
|
