BlackrockMuniassets MUA full analysis,charts,indicators,moving averages,SMA,DMA,EMA,ADX,MACD,RSIBlackrock Muniassets MUA WideScreen charts, DMA,SMA,EMA technical analysis, forecast prediction, by indicators ADX,MACD,RSI,CCI USA stock exchange
operates under N A sector & deals in N A
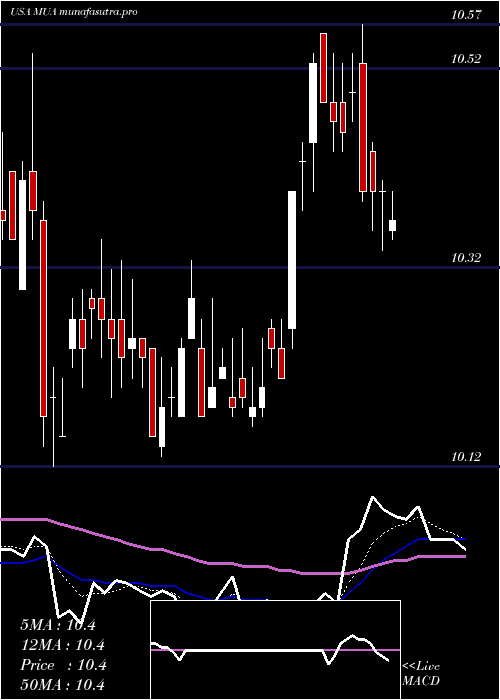
Daily price and charts and targets BlackrockMuniassets Strong Daily Stock price targets for BlackrockMuniassets MUA are 10.76 and 10.86 | Daily Target 1 | 10.68 | | Daily Target 2 | 10.73 | | Daily Target 3 | 10.78 | | Daily Target 4 | 10.83 | | Daily Target 5 | 10.88 |
Daily price and volume Blackrock Muniassets
| Date |
Closing |
Open |
Range |
Volume |
Mon 20 October 2025 |
10.78 (0.47%) |
10.75 |
10.73 - 10.83 |
0.9704 times |
Fri 17 October 2025 |
10.73 (-0.37%) |
10.78 |
10.66 - 10.80 |
1.1343 times |
Thu 16 October 2025 |
10.77 (-0.19%) |
10.83 |
10.70 - 10.86 |
0.7626 times |
Wed 15 October 2025 |
10.79 (-0.28%) |
10.77 |
10.72 - 10.85 |
0.8697 times |
Tue 14 October 2025 |
10.82 (0.56%) |
10.76 |
10.76 - 10.86 |
1.0827 times |
Mon 13 October 2025 |
10.76 (-2.18%) |
10.74 |
10.72 - 10.83 |
1.0297 times |
Tue 07 October 2025 |
11.00 (0.73%) |
10.92 |
10.92 - 11.04 |
0.8801 times |
Mon 06 October 2025 |
10.92 (-1.36%) |
11.07 |
10.87 - 11.07 |
1.3665 times |
Fri 03 October 2025 |
11.07 (-0.27%) |
11.09 |
11.02 - 11.13 |
0.6452 times |
Thu 02 October 2025 |
11.10 (-0.98%) |
11.18 |
11.03 - 11.20 |
1.2588 times |
Wed 01 October 2025 |
11.21 (0.99%) |
11.20 |
11.11 - 11.25 |
1.7537 times |
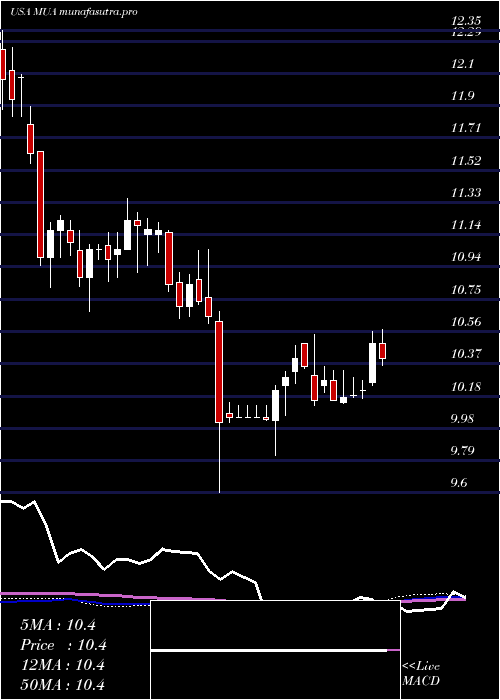
Weekly price and charts BlackrockMuniassets Strong weekly Stock price targets for BlackrockMuniassets MUA are 10.76 and 10.86 | Weekly Target 1 | 10.68 | | Weekly Target 2 | 10.73 | | Weekly Target 3 | 10.78 | | Weekly Target 4 | 10.83 | | Weekly Target 5 | 10.88 |
Weekly price and volumes for Blackrock Muniassets
| Date |
Closing |
Open |
Range |
Volume |
Mon 20 October 2025 |
10.78 (0.47%) |
10.75 |
10.73 - 10.83 |
0.2004 times |
Fri 17 October 2025 |
10.73 (-2.45%) |
10.74 |
10.66 - 10.86 |
1.0074 times |
Tue 07 October 2025 |
11.00 (-0.63%) |
11.07 |
10.87 - 11.07 |
0.4639 times |
Fri 03 October 2025 |
11.07 (-0.81%) |
11.30 |
11.02 - 11.34 |
1.3102 times |
Fri 26 September 2025 |
11.16 (-2.79%) |
11.46 |
11.01 - 11.48 |
1.5163 times |
Fri 19 September 2025 |
11.48 (-2.63%) |
11.75 |
11.47 - 11.78 |
0.9272 times |
Fri 12 September 2025 |
11.79 (5.65%) |
11.20 |
11.18 - 11.79 |
1.2427 times |
Fri 05 September 2025 |
11.16 (4.01%) |
10.70 |
10.58 - 11.20 |
1.3248 times |
Fri 29 August 2025 |
10.73 (0%) |
10.67 |
10.65 - 10.74 |
0.53 times |
Fri 29 August 2025 |
10.73 (1.13%) |
10.57 |
10.46 - 10.74 |
1.4772 times |
Fri 22 August 2025 |
10.61 (0.66%) |
10.58 |
10.42 - 10.70 |
1.3098 times |
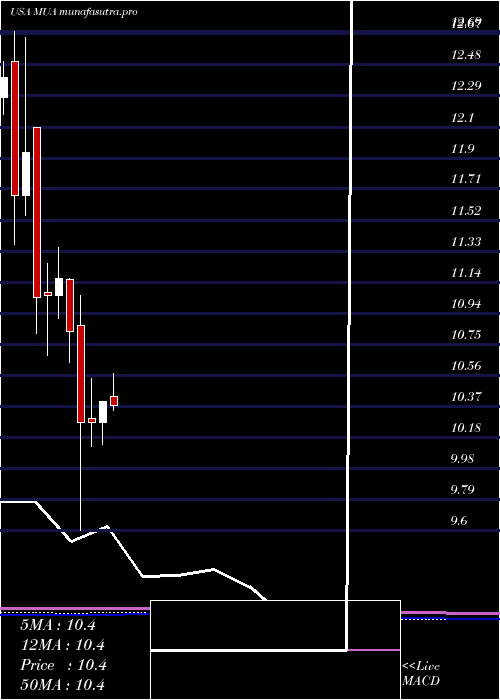
Monthly price and charts BlackrockMuniassets Strong monthly Stock price targets for BlackrockMuniassets MUA are 10.43 and 11.02 | Monthly Target 1 | 10.31 | | Monthly Target 2 | 10.54 | | Monthly Target 3 | 10.896666666667 | | Monthly Target 4 | 11.13 | | Monthly Target 5 | 11.49 |
Monthly price and volumes Blackrock Muniassets
| Date |
Closing |
Open |
Range |
Volume |
Mon 20 October 2025 |
10.78 (-2.88%) |
11.20 |
10.66 - 11.25 |
0.4124 times |
Tue 30 September 2025 |
11.10 (3.45%) |
10.70 |
10.58 - 11.79 |
0.9459 times |
Fri 29 August 2025 |
10.73 (3.57%) |
10.37 |
10.31 - 10.75 |
1.0577 times |
Thu 31 July 2025 |
10.36 (-0.38%) |
10.43 |
10.02 - 10.57 |
1.1324 times |
Mon 30 June 2025 |
10.40 (1.27%) |
10.27 |
10.13 - 10.40 |
0.8868 times |
Fri 30 May 2025 |
10.27 (0%) |
10.29 |
10.12 - 10.54 |
0.822 times |
Wed 30 April 2025 |
10.27 (-5.17%) |
10.87 |
9.60 - 11.05 |
1.3632 times |
Mon 31 March 2025 |
10.83 (-2.96%) |
11.15 |
10.64 - 11.16 |
1.2397 times |
Fri 28 February 2025 |
11.16 (1%) |
11.05 |
10.91 - 11.35 |
1.2188 times |
Fri 31 January 2025 |
11.05 (0.09%) |
11.07 |
10.68 - 11.25 |
0.9211 times |
Tue 31 December 2024 |
11.04 (-7.54%) |
12.09 |
10.82 - 12.09 |
0.9881 times |
DMA SMA EMA moving averages of Blackrock Muniassets MUA
DMA (daily moving average) of Blackrock Muniassets MUA
| DMA period | DMA value | | 5 day DMA | 10.78 | | 12 day DMA | 10.92 | | 20 day DMA | 11.07 | | 35 day DMA | 11.11 | | 50 day DMA | 10.94 | | 100 day DMA | 10.61 | | 150 day DMA | 10.53 | | 200 day DMA | 10.66 | EMA (exponential moving average) of Blackrock Muniassets MUA
| EMA period | EMA current | EMA prev | EMA prev2 | | 5 day EMA | 10.79 | 10.8 | 10.84 | | 12 day EMA | 10.9 | 10.92 | 10.96 | | 20 day EMA | 10.96 | 10.98 | 11.01 | | 35 day EMA | 10.93 | 10.94 | 10.95 | | 50 day EMA | 10.88 | 10.88 | 10.89 |
SMA (simple moving average) of Blackrock Muniassets MUA
| SMA period | SMA current | SMA prev | SMA prev2 | | 5 day SMA | 10.78 | 10.77 | 10.83 | | 12 day SMA | 10.92 | 10.96 | 10.99 | | 20 day SMA | 11.07 | 11.1 | 11.15 | | 35 day SMA | 11.11 | 11.1 | 11.1 | | 50 day SMA | 10.94 | 10.93 | 10.92 | | 100 day SMA | 10.61 | 10.6 | 10.6 | | 150 day SMA | 10.53 | 10.53 | 10.53 | | 200 day SMA | 10.66 | 10.66 | 10.66 |
|
|
