MastecInc MTZ full analysis,charts,indicators,moving averages,SMA,DMA,EMA,ADX,MACD,RSIMastec Inc MTZ WideScreen charts, DMA,SMA,EMA technical analysis, forecast prediction, by indicators ADX,MACD,RSI,CCI USA stock exchange
operates under Basic Industries sector & deals in Water Supply
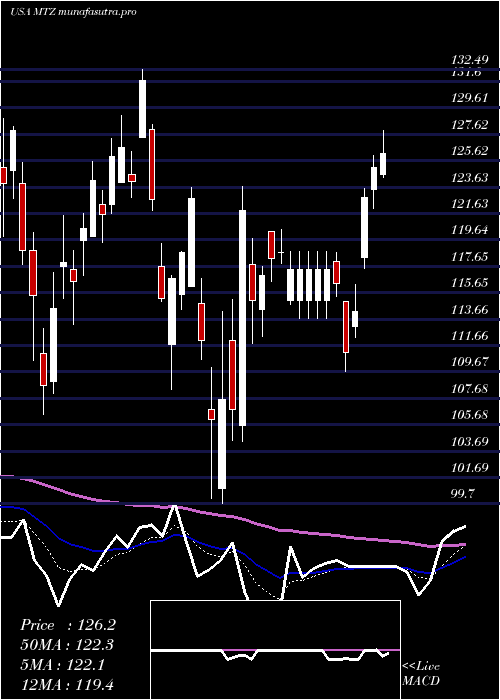
Daily price and charts and targets MastecInc Strong Daily Stock price targets for MastecInc MTZ are 216.65 and 222.26 | Daily Target 1 | 212.09 | | Daily Target 2 | 215.6 | | Daily Target 3 | 217.69666666667 | | Daily Target 4 | 221.21 | | Daily Target 5 | 223.31 |
Daily price and volume Mastec Inc
| Date |
Closing |
Open |
Range |
Volume |
Thu 04 December 2025 |
219.12 (0.38%) |
216.05 |
214.18 - 219.79 |
0.8912 times |
Wed 03 December 2025 |
218.29 (2.49%) |
211.71 |
207.94 - 219.29 |
1.3077 times |
Tue 02 December 2025 |
212.98 (0.4%) |
215.03 |
210.92 - 217.43 |
1.0627 times |
Mon 01 December 2025 |
212.14 (-0.81%) |
209.61 |
206.79 - 212.94 |
1.0237 times |
Fri 28 November 2025 |
213.88 (1.62%) |
210.57 |
210.19 - 214.25 |
0.4484 times |
Wed 26 November 2025 |
210.47 (2.23%) |
207.13 |
206.67 - 213.88 |
0.6423 times |
Tue 25 November 2025 |
205.87 (0.61%) |
204.15 |
199.21 - 207.54 |
0.6196 times |
Mon 24 November 2025 |
204.62 (5.98%) |
195.52 |
195.00 - 205.68 |
0.8938 times |
Fri 21 November 2025 |
193.08 (0.66%) |
192.27 |
187.21 - 195.65 |
0.9144 times |
Thu 20 November 2025 |
191.82 (-2.63%) |
202.90 |
190.69 - 209.47 |
2.1962 times |
Wed 19 November 2025 |
197.01 (1.07%) |
197.46 |
194.91 - 201.20 |
0.8313 times |
Weekly price and charts MastecInc Strong weekly Stock price targets for MastecInc MTZ are 212.96 and 225.96 | Weekly Target 1 | 202.23 | | Weekly Target 2 | 210.68 | | Weekly Target 3 | 215.23333333333 | | Weekly Target 4 | 223.68 | | Weekly Target 5 | 228.23 |
Weekly price and volumes for Mastec Inc
| Date |
Closing |
Open |
Range |
Volume |
Thu 04 December 2025 |
219.12 (2.45%) |
209.61 |
206.79 - 219.79 |
0.9097 times |
Fri 28 November 2025 |
213.88 (10.77%) |
195.52 |
195.00 - 214.25 |
0.5528 times |
Fri 21 November 2025 |
193.08 (0.45%) |
191.94 |
187.21 - 209.47 |
1.3527 times |
Fri 14 November 2025 |
192.22 (-4.1%) |
206.02 |
182.34 - 207.94 |
0.8869 times |
Fri 07 November 2025 |
200.44 (-1.82%) |
196.44 |
188.00 - 202.98 |
0.7488 times |
Fri 31 October 2025 |
204.16 (0%) |
206.83 |
197.97 - 216.00 |
0.7992 times |
Fri 31 October 2025 |
204.16 (-3.64%) |
215.10 |
197.97 - 224.03 |
1.9488 times |
Fri 24 October 2025 |
211.88 (4.96%) |
206.21 |
190.01 - 215.72 |
1.236 times |
Fri 17 October 2025 |
201.86 (-5.22%) |
200.88 |
196.65 - 209.02 |
1.2004 times |
Tue 07 October 2025 |
212.98 (-1.31%) |
216.80 |
207.98 - 221.83 |
0.3646 times |
Fri 03 October 2025 |
215.81 (3.69%) |
210.39 |
206.93 - 219.09 |
0.9363 times |
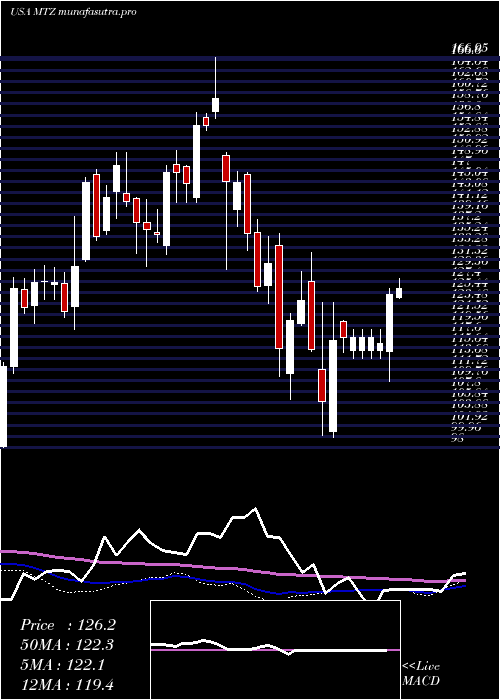
Monthly price and charts MastecInc Strong monthly Stock price targets for MastecInc MTZ are 212.96 and 225.96 | Monthly Target 1 | 202.23 | | Monthly Target 2 | 210.68 | | Monthly Target 3 | 215.23333333333 | | Monthly Target 4 | 223.68 | | Monthly Target 5 | 228.23 |
Monthly price and volumes Mastec Inc
| Date |
Closing |
Open |
Range |
Volume |
Thu 04 December 2025 |
219.12 (2.45%) |
209.61 |
206.79 - 219.79 |
0.1846 times |
Fri 28 November 2025 |
213.88 (4.76%) |
196.44 |
182.34 - 214.25 |
0.7185 times |
Fri 31 October 2025 |
204.16 (-4.06%) |
211.30 |
190.01 - 224.03 |
1.2327 times |
Tue 30 September 2025 |
212.81 (17.13%) |
179.51 |
171.05 - 213.66 |
1.0621 times |
Fri 29 August 2025 |
181.69 (-3.97%) |
169.36 |
160.08 - 187.02 |
1.1537 times |
Thu 31 July 2025 |
189.21 (11.02%) |
169.85 |
164.12 - 194.00 |
1.0794 times |
Mon 30 June 2025 |
170.43 (9.3%) |
155.70 |
152.43 - 172.71 |
0.808 times |
Fri 30 May 2025 |
155.93 (22.47%) |
133.00 |
131.68 - 161.46 |
1.0853 times |
Wed 30 April 2025 |
127.32 (9.09%) |
115.50 |
99.70 - 128.24 |
1.1197 times |
Mon 31 March 2025 |
116.71 (-10.63%) |
133.64 |
106.45 - 135.87 |
1.556 times |
Fri 28 February 2025 |
130.59 (-9.99%) |
140.05 |
123.35 - 146.77 |
1.1574 times |

DMA SMA EMA moving averages of Mastec Inc MTZ
DMA (daily moving average) of Mastec Inc MTZ
| DMA period | DMA value | | 5 day DMA | 215.28 | | 12 day DMA | 206.18 | | 20 day DMA | 202.26 | | 35 day DMA | 203.96 | | 50 day DMA | 205.64 | | 100 day DMA | 193.63 | | 150 day DMA | 181.52 | | 200 day DMA | 166.39 | EMA (exponential moving average) of Mastec Inc MTZ
| EMA period | EMA current | EMA prev | EMA prev2 | | 5 day EMA | 214.95 | 212.87 | 210.16 | | 12 day EMA | 209.19 | 207.38 | 205.4 | | 20 day EMA | 206.51 | 205.18 | 203.8 | | 35 day EMA | 205.15 | 204.33 | 203.51 | | 50 day EMA | 205.82 | 205.28 | 204.75 |
SMA (simple moving average) of Mastec Inc MTZ
| SMA period | SMA current | SMA prev | SMA prev2 | | 5 day SMA | 215.28 | 213.55 | 211.07 | | 12 day SMA | 206.18 | 204.04 | 201.87 | | 20 day SMA | 202.26 | 201.26 | 200.12 | | 35 day SMA | 203.96 | 203.54 | 203.18 | | 50 day SMA | 205.64 | 205.28 | 204.9 | | 100 day SMA | 193.63 | 193.13 | 192.64 | | 150 day SMA | 181.52 | 180.89 | 180.25 | | 200 day SMA | 166.39 | 165.98 | 165.58 |
|
|
