MacomTechnology MTSI full analysis,charts,indicators,moving averages,SMA,DMA,EMA,ADX,MACD,RSIMacom Technology MTSI WideScreen charts, DMA,SMA,EMA technical analysis, forecast prediction, by indicators ADX,MACD,RSI,CCI USA stock exchange
operates under Technology sector & deals in Semiconductors
Daily price and charts and targets MacomTechnology Strong Daily Stock price targets for MacomTechnology MTSI are 184.15 and 192.91 | Daily Target 1 | 177.34 | | Daily Target 2 | 182.2 | | Daily Target 3 | 186.1 | | Daily Target 4 | 190.96 | | Daily Target 5 | 194.86 |
Daily price and volume Macom Technology
| Date |
Closing |
Open |
Range |
Volume |
Thu 04 December 2025 |
187.06 (1.96%) |
183.36 |
181.24 - 190.00 |
1.3954 times |
Wed 03 December 2025 |
183.46 (3.12%) |
177.27 |
175.50 - 183.90 |
1.5503 times |
Tue 02 December 2025 |
177.91 (2.93%) |
175.11 |
174.79 - 180.10 |
0.9528 times |
Mon 01 December 2025 |
172.85 (-1.22%) |
171.18 |
169.15 - 175.43 |
0.8641 times |
Fri 28 November 2025 |
174.99 (4.12%) |
169.62 |
168.46 - 175.06 |
0.7832 times |
Wed 26 November 2025 |
168.06 (1.31%) |
167.47 |
165.79 - 170.99 |
0.6448 times |
Tue 25 November 2025 |
165.88 (-0.05%) |
162.36 |
159.00 - 166.18 |
1.1039 times |
Mon 24 November 2025 |
165.97 (4.87%) |
159.90 |
158.01 - 166.88 |
1.0554 times |
Fri 21 November 2025 |
158.27 (1.85%) |
155.41 |
150.80 - 160.55 |
0.6342 times |
Thu 20 November 2025 |
155.39 (-3.82%) |
166.25 |
154.35 - 169.39 |
1.0157 times |
Wed 19 November 2025 |
161.57 (2.12%) |
158.13 |
158.04 - 164.26 |
0.5898 times |
Weekly price and charts MacomTechnology Strong weekly Stock price targets for MacomTechnology MTSI are 178.11 and 198.96 | Weekly Target 1 | 161.22 | | Weekly Target 2 | 174.14 | | Weekly Target 3 | 182.07 | | Weekly Target 4 | 194.99 | | Weekly Target 5 | 202.92 |
Weekly price and volumes for Macom Technology
| Date |
Closing |
Open |
Range |
Volume |
Thu 04 December 2025 |
187.06 (6.9%) |
171.18 |
169.15 - 190.00 |
1.2795 times |
Fri 28 November 2025 |
174.99 (10.56%) |
159.90 |
158.01 - 175.06 |
0.9638 times |
Fri 21 November 2025 |
158.27 (-2.6%) |
160.65 |
150.80 - 169.39 |
0.9195 times |
Fri 14 November 2025 |
162.50 (-4.43%) |
173.24 |
156.63 - 179.38 |
1.2058 times |
Fri 07 November 2025 |
170.03 (14.78%) |
146.14 |
144.06 - 170.22 |
1.2066 times |
Fri 31 October 2025 |
148.13 (0%) |
151.56 |
148.07 - 153.51 |
0.2622 times |
Fri 31 October 2025 |
148.13 (5.17%) |
142.90 |
142.00 - 154.86 |
1.1407 times |
Fri 24 October 2025 |
140.85 (2.95%) |
138.61 |
133.35 - 142.61 |
0.7443 times |
Fri 17 October 2025 |
136.82 (11.98%) |
126.55 |
124.74 - 140.98 |
1.0999 times |
Fri 10 October 2025 |
122.18 (-4.1%) |
129.38 |
121.97 - 134.44 |
1.1777 times |
Fri 03 October 2025 |
127.41 (-1.53%) |
130.54 |
122.29 - 130.99 |
1.0043 times |

Monthly price and charts MacomTechnology Strong monthly Stock price targets for MacomTechnology MTSI are 178.11 and 198.96 | Monthly Target 1 | 161.22 | | Monthly Target 2 | 174.14 | | Monthly Target 3 | 182.07 | | Monthly Target 4 | 194.99 | | Monthly Target 5 | 202.92 |
Monthly price and volumes Macom Technology
| Date |
Closing |
Open |
Range |
Volume |
Thu 04 December 2025 |
187.06 (6.9%) |
171.18 |
169.15 - 190.00 |
0.3495 times |
Fri 28 November 2025 |
174.99 (18.13%) |
146.14 |
144.06 - 179.38 |
1.1733 times |
Fri 31 October 2025 |
148.13 (18.99%) |
124.14 |
121.97 - 154.86 |
1.3371 times |
Tue 30 September 2025 |
124.49 (-2.86%) |
125.51 |
122.29 - 134.22 |
1.4957 times |
Fri 29 August 2025 |
128.15 (-6.56%) |
134.10 |
118.16 - 141.48 |
1.1568 times |
Thu 31 July 2025 |
137.14 (-4.29%) |
141.72 |
133.38 - 144.00 |
0.6912 times |
Mon 30 June 2025 |
143.29 (17.83%) |
121.80 |
121.52 - 144.15 |
0.7906 times |
Fri 30 May 2025 |
121.61 (17.21%) |
105.82 |
105.42 - 126.18 |
1.0803 times |
Wed 30 April 2025 |
103.75 (3.36%) |
99.93 |
84.00 - 108.34 |
0.9952 times |
Mon 31 March 2025 |
100.38 (-13.21%) |
116.61 |
94.01 - 116.61 |
0.9303 times |
Fri 28 February 2025 |
115.66 (-12.54%) |
127.51 |
110.28 - 136.31 |
0.9642 times |

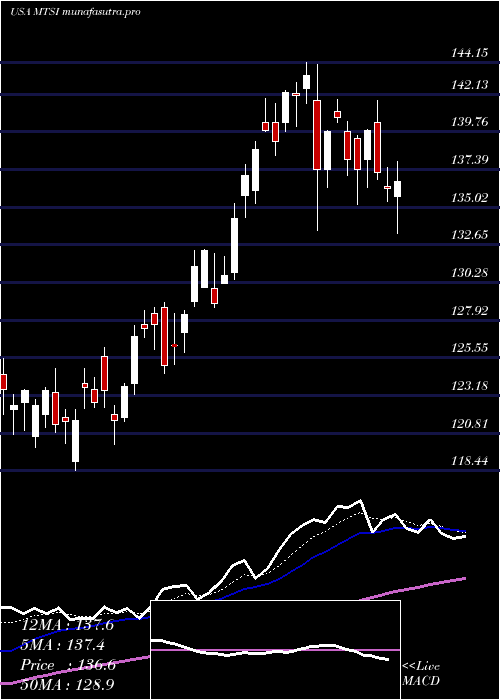
DMA SMA EMA moving averages of Macom Technology MTSI
DMA (daily moving average) of Macom Technology MTSI
| DMA period | DMA value | | 5 day DMA | 179.25 | | 12 day DMA | 169.14 | | 20 day DMA | 168.52 | | 35 day DMA | 157.96 | | 50 day DMA | 149.17 | | 100 day DMA | 140.11 | | 150 day DMA | 136.19 | | 200 day DMA | 128.4 | EMA (exponential moving average) of Macom Technology MTSI
| EMA period | EMA current | EMA prev | EMA prev2 | | 5 day EMA | 179.75 | 176.09 | 172.41 | | 12 day EMA | 172.57 | 169.94 | 167.48 | | 20 day EMA | 167.3 | 165.22 | 163.3 | | 35 day EMA | 158.86 | 157.2 | 155.65 | | 50 day EMA | 150.51 | 149.02 | 147.61 |
SMA (simple moving average) of Macom Technology MTSI
| SMA period | SMA current | SMA prev | SMA prev2 | | 5 day SMA | 179.25 | 175.45 | 171.94 | | 12 day SMA | 169.14 | 166.87 | 165.12 | | 20 day SMA | 168.52 | 166.65 | 164.69 | | 35 day SMA | 157.96 | 156.52 | 155.04 | | 50 day SMA | 149.17 | 147.96 | 146.87 | | 100 day SMA | 140.11 | 139.61 | 139.14 | | 150 day SMA | 136.19 | 135.63 | 135.1 | | 200 day SMA | 128.4 | 128.08 | 127.78 |
|
|
