MatchGroup MTCH full analysis,charts,indicators,moving averages,SMA,DMA,EMA,ADX,MACD,RSIMatch Group MTCH WideScreen charts, DMA,SMA,EMA technical analysis, forecast prediction, by indicators ADX,MACD,RSI,CCI USA stock exchange
operates under Technology sector & deals in Computer Software Programming Data Processing
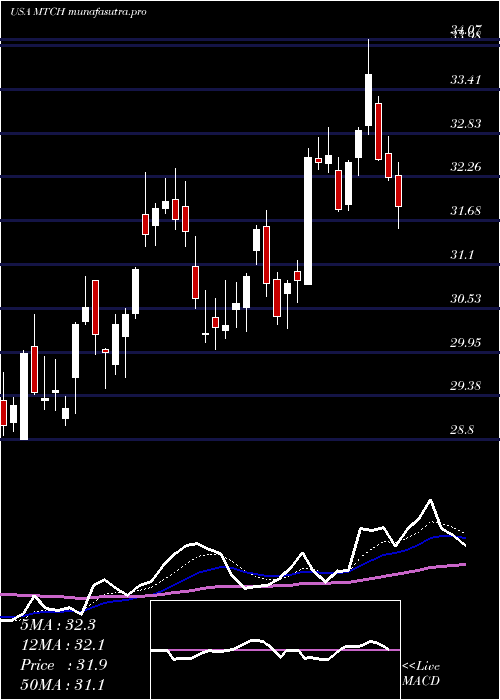
Daily price and charts and targets MatchGroup Strong Daily Stock price targets for MatchGroup MTCH are 32.68 and 33.49 | Daily Target 1 | 32.03 | | Daily Target 2 | 32.51 | | Daily Target 3 | 32.843333333333 | | Daily Target 4 | 33.32 | | Daily Target 5 | 33.65 |
Daily price and volume Match Group
| Date |
Closing |
Open |
Range |
Volume |
Mon 20 October 2025 |
32.98 (1.7%) |
32.65 |
32.37 - 33.18 |
0.393 times |
Fri 17 October 2025 |
32.43 (0.25%) |
32.34 |
32.09 - 32.51 |
0.7342 times |
Thu 16 October 2025 |
32.35 (-1.58%) |
32.95 |
31.98 - 33.00 |
0.7211 times |
Wed 15 October 2025 |
32.87 (1.33%) |
32.85 |
32.47 - 33.09 |
0.9666 times |
Tue 14 October 2025 |
32.44 (1%) |
31.61 |
31.61 - 32.51 |
0.7761 times |
Mon 13 October 2025 |
32.12 (2.13%) |
31.81 |
31.19 - 32.16 |
1.8883 times |
Fri 10 October 2025 |
31.45 (-3.17%) |
32.56 |
31.40 - 32.66 |
1.3827 times |
Thu 09 October 2025 |
32.48 (-2.2%) |
33.26 |
32.45 - 33.30 |
1.0123 times |
Wed 08 October 2025 |
33.21 (0.33%) |
33.20 |
33.03 - 33.69 |
1.0663 times |
Tue 07 October 2025 |
33.10 (-2.3%) |
33.95 |
33.04 - 34.09 |
1.0594 times |
Mon 06 October 2025 |
33.88 (-1.28%) |
34.35 |
33.88 - 34.65 |
0.8025 times |
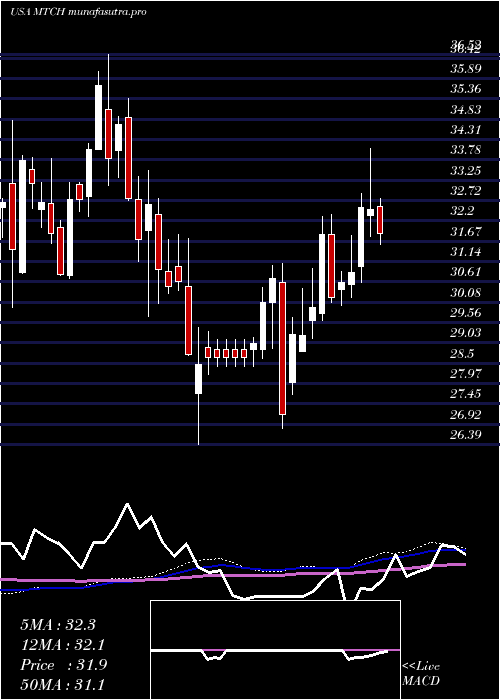
Weekly price and charts MatchGroup Strong weekly Stock price targets for MatchGroup MTCH are 32.68 and 33.49 | Weekly Target 1 | 32.03 | | Weekly Target 2 | 32.51 | | Weekly Target 3 | 32.843333333333 | | Weekly Target 4 | 33.32 | | Weekly Target 5 | 33.65 |
Weekly price and volumes for Match Group
| Date |
Closing |
Open |
Range |
Volume |
Mon 20 October 2025 |
32.98 (1.7%) |
32.65 |
32.37 - 33.18 |
0.0861 times |
Fri 17 October 2025 |
32.43 (3.12%) |
31.81 |
31.19 - 33.09 |
1.1144 times |
Fri 10 October 2025 |
31.45 (-8.36%) |
34.35 |
31.40 - 34.65 |
1.1663 times |
Fri 03 October 2025 |
34.32 (-5.3%) |
36.38 |
34.20 - 36.94 |
1.6254 times |
Fri 26 September 2025 |
36.24 (-5.89%) |
38.38 |
35.65 - 38.66 |
1.3984 times |
Fri 19 September 2025 |
38.51 (2.01%) |
37.79 |
37.06 - 38.82 |
1.4522 times |
Fri 12 September 2025 |
37.75 (-1.1%) |
38.24 |
37.22 - 38.84 |
1.165 times |
Fri 05 September 2025 |
38.17 (2.22%) |
36.72 |
36.54 - 38.18 |
0.7703 times |
Fri 29 August 2025 |
37.34 (0%) |
37.53 |
36.89 - 38.00 |
0.2623 times |
Fri 29 August 2025 |
37.34 (0.11%) |
37.27 |
36.76 - 38.00 |
0.9596 times |
Fri 22 August 2025 |
37.30 (-2.56%) |
38.27 |
36.28 - 38.49 |
1.2487 times |
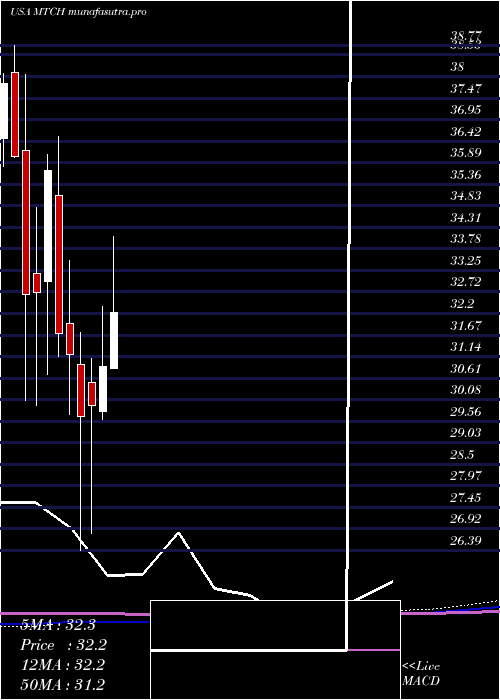
Monthly price and charts MatchGroup Strong monthly Stock price targets for MatchGroup MTCH are 29.89 and 34.28 | Monthly Target 1 | 28.86 | | Monthly Target 2 | 30.92 | | Monthly Target 3 | 33.25 | | Monthly Target 4 | 35.31 | | Monthly Target 5 | 37.64 |
Monthly price and volumes Match Group
| Date |
Closing |
Open |
Range |
Volume |
Mon 20 October 2025 |
32.98 (-6.63%) |
35.18 |
31.19 - 35.58 |
0.5399 times |
Tue 30 September 2025 |
35.32 (-5.41%) |
36.72 |
35.22 - 38.84 |
0.986 times |
Fri 29 August 2025 |
37.34 (8.96%) |
33.90 |
33.23 - 39.20 |
1.0897 times |
Thu 31 July 2025 |
34.27 (10.94%) |
30.84 |
30.84 - 34.78 |
0.8986 times |
Mon 30 June 2025 |
30.89 (3.17%) |
29.79 |
29.61 - 32.37 |
0.8722 times |
Fri 30 May 2025 |
29.94 (0.94%) |
30.50 |
26.80 - 31.08 |
1.2896 times |
Wed 30 April 2025 |
29.66 (-4.94%) |
30.94 |
26.39 - 31.73 |
0.998 times |
Mon 31 March 2025 |
31.20 (-1.61%) |
31.96 |
29.72 - 33.49 |
1.1085 times |
Fri 28 February 2025 |
31.71 (-11.18%) |
35.08 |
31.14 - 36.52 |
1.303 times |
Fri 31 January 2025 |
35.70 (9.14%) |
32.97 |
30.69 - 36.08 |
0.9146 times |
Tue 31 December 2024 |
32.71 (0.15%) |
33.17 |
29.95 - 34.80 |
0.8903 times |
DMA SMA EMA moving averages of Match Group MTCH
DMA (daily moving average) of Match Group MTCH
| DMA period | DMA value | | 5 day DMA | 32.61 | | 12 day DMA | 32.8 | | 20 day DMA | 34 | | 35 day DMA | 35.62 | | 50 day DMA | 36.19 | | 100 day DMA | 34.28 | | 150 day DMA | 32.7 | | 200 day DMA | 32.76 | EMA (exponential moving average) of Match Group MTCH
| EMA period | EMA current | EMA prev | EMA prev2 | | 5 day EMA | 32.66 | 32.5 | 32.53 | | 12 day EMA | 33.11 | 33.13 | 33.26 | | 20 day EMA | 33.85 | 33.94 | 34.1 | | 35 day EMA | 34.76 | 34.86 | 35 | | 50 day EMA | 35.8 | 35.92 | 36.06 |
SMA (simple moving average) of Match Group MTCH
| SMA period | SMA current | SMA prev | SMA prev2 | | 5 day SMA | 32.61 | 32.44 | 32.25 | | 12 day SMA | 32.8 | 32.95 | 33.13 | | 20 day SMA | 34 | 34.17 | 34.47 | | 35 day SMA | 35.62 | 35.75 | 35.89 | | 50 day SMA | 36.19 | 36.24 | 36.31 | | 100 day SMA | 34.28 | 34.26 | 34.22 | | 150 day SMA | 32.7 | 32.69 | 32.68 | | 200 day SMA | 32.76 | 32.76 | 32.76 |
|
|
