MmtecInc MTC full analysis,charts,indicators,moving averages,SMA,DMA,EMA,ADX,MACD,RSIMmtec Inc MTC WideScreen charts, DMA,SMA,EMA technical analysis, forecast prediction, by indicators ADX,MACD,RSI,CCI USA stock exchange
operates under N A sector & deals in N A
Daily price and charts and targets MmtecInc Strong Daily Stock price targets for MmtecInc MTC are 2.54 and 2.83 | Daily Target 1 | 2.3 | | Daily Target 2 | 2.48 | | Daily Target 3 | 2.59 | | Daily Target 4 | 2.77 | | Daily Target 5 | 2.88 |
Daily price and volume Mmtec Inc
| Date |
Closing |
Open |
Range |
Volume |
Thu 04 December 2025 |
2.66 (4.72%) |
2.47 |
2.41 - 2.70 |
0.5334 times |
Wed 03 December 2025 |
2.54 (-10.88%) |
2.87 |
2.54 - 2.91 |
0.4834 times |
Tue 02 December 2025 |
2.85 (1.42%) |
2.80 |
2.77 - 2.94 |
0.6868 times |
Mon 01 December 2025 |
2.81 (3.31%) |
2.69 |
2.64 - 2.89 |
0.654 times |
Fri 28 November 2025 |
2.72 (10.57%) |
2.47 |
2.42 - 2.80 |
1.2873 times |
Wed 26 November 2025 |
2.46 (-2.77%) |
2.48 |
2.42 - 2.53 |
0.4275 times |
Tue 25 November 2025 |
2.53 (-0.78%) |
2.51 |
2.42 - 2.60 |
0.9192 times |
Mon 24 November 2025 |
2.55 (10.39%) |
2.31 |
2.31 - 2.60 |
1.4143 times |
Fri 21 November 2025 |
2.31 (9.48%) |
2.06 |
2.06 - 2.50 |
2.1583 times |
Thu 20 November 2025 |
2.11 (-1.4%) |
2.09 |
2.05 - 2.26 |
1.4359 times |
Wed 19 November 2025 |
2.14 (1.42%) |
2.06 |
2.06 - 2.32 |
3.4478 times |
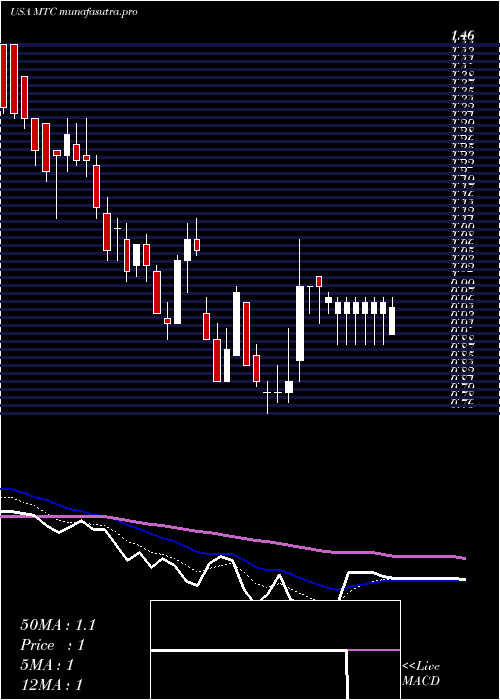
Weekly price and charts MmtecInc Strong weekly Stock price targets for MmtecInc MTC are 2.27 and 2.8 | Weekly Target 1 | 2.14 | | Weekly Target 2 | 2.4 | | Weekly Target 3 | 2.67 | | Weekly Target 4 | 2.93 | | Weekly Target 5 | 3.2 |
Weekly price and volumes for Mmtec Inc
| Date |
Closing |
Open |
Range |
Volume |
Thu 04 December 2025 |
2.66 (-2.21%) |
2.69 |
2.41 - 2.94 |
0.01 times |
Fri 28 November 2025 |
2.72 (17.75%) |
2.31 |
2.31 - 2.80 |
0.0171 times |
Fri 21 November 2025 |
2.31 (-1.7%) |
2.42 |
1.88 - 2.50 |
0.0607 times |
Fri 14 November 2025 |
2.35 (-11.65%) |
2.45 |
2.10 - 3.39 |
0.5599 times |
Fri 07 November 2025 |
2.66 (303.03%) |
0.41 |
0.25 - 3.89 |
9.273 times |
Fri 31 October 2025 |
0.66 (0%) |
0.69 |
0.65 - 0.82 |
0.0115 times |
Fri 31 October 2025 |
0.66 (-15.38%) |
0.84 |
0.65 - 0.86 |
0.0297 times |
Fri 24 October 2025 |
0.78 (-13.33%) |
0.90 |
0.76 - 0.92 |
0.0094 times |
Fri 17 October 2025 |
0.90 (5.88%) |
0.85 |
0.81 - 1.00 |
0.0232 times |
Fri 10 October 2025 |
0.85 (0%) |
0.87 |
0.80 - 0.88 |
0.0056 times |
Fri 03 October 2025 |
0.85 (-3.41%) |
0.87 |
0.80 - 0.88 |
0.0076 times |

Monthly price and charts MmtecInc Strong monthly Stock price targets for MmtecInc MTC are 2.27 and 2.8 | Monthly Target 1 | 2.14 | | Monthly Target 2 | 2.4 | | Monthly Target 3 | 2.67 | | Monthly Target 4 | 2.93 | | Monthly Target 5 | 3.2 |
Monthly price and volumes Mmtec Inc
| Date |
Closing |
Open |
Range |
Volume |
Thu 04 December 2025 |
2.66 (-2.21%) |
2.69 |
2.41 - 2.94 |
0.0095 times |
Fri 28 November 2025 |
2.72 (312.12%) |
0.41 |
0.25 - 3.89 |
9.4279 times |
Fri 31 October 2025 |
0.66 (-20.48%) |
0.85 |
0.65 - 1.00 |
0.0786 times |
Tue 30 September 2025 |
0.83 (-14.43%) |
0.93 |
0.78 - 1.80 |
0.298 times |
Fri 29 August 2025 |
0.97 (7.78%) |
0.89 |
0.86 - 1.18 |
0.0293 times |
Thu 31 July 2025 |
0.90 (-13.46%) |
1.02 |
0.85 - 1.09 |
0.0256 times |
Mon 30 June 2025 |
1.04 (1.96%) |
1.00 |
0.89 - 1.10 |
0.0313 times |
Fri 30 May 2025 |
1.02 (-15%) |
1.20 |
0.96 - 1.27 |
0.025 times |
Wed 30 April 2025 |
1.20 (46.34%) |
0.82 |
0.76 - 1.20 |
0.035 times |
Mon 31 March 2025 |
0.82 (-34.92%) |
1.31 |
0.82 - 1.32 |
0.0398 times |
Fri 28 February 2025 |
1.26 (-11.89%) |
1.41 |
1.23 - 1.75 |
0.0541 times |

DMA SMA EMA moving averages of Mmtec Inc MTC
DMA (daily moving average) of Mmtec Inc MTC
| DMA period | DMA value | | 5 day DMA | 2.72 | | 12 day DMA | 2.48 | | 20 day DMA | 2.47 | | 35 day DMA | 1.77 | | 50 day DMA | 1.5 | | 100 day DMA | 1.22 | | 150 day DMA | 1.16 | | 200 day DMA | 1.14 | EMA (exponential moving average) of Mmtec Inc MTC
| EMA period | EMA current | EMA prev | EMA prev2 | | 5 day EMA | 2.65 | 2.64 | 2.69 | | 12 day EMA | 2.51 | 2.48 | 2.47 | | 20 day EMA | 2.3 | 2.26 | 2.23 | | 35 day EMA | 1.99 | 1.95 | 1.91 | | 50 day EMA | 1.57 | 1.53 | 1.49 |
SMA (simple moving average) of Mmtec Inc MTC
| SMA period | SMA current | SMA prev | SMA prev2 | | 5 day SMA | 2.72 | 2.68 | 2.67 | | 12 day SMA | 2.48 | 2.43 | 2.41 | | 20 day SMA | 2.47 | 2.44 | 2.32 | | 35 day SMA | 1.77 | 1.72 | 1.68 | | 50 day SMA | 1.5 | 1.47 | 1.43 | | 100 day SMA | 1.22 | 1.2 | 1.19 | | 150 day SMA | 1.16 | 1.15 | 1.14 | | 200 day SMA | 1.14 | 1.13 | 1.13 |
|
|
