MT MTB full analysis,charts,indicators,moving averages,SMA,DMA,EMA,ADX,MACD,RSIM T MTB WideScreen charts, DMA,SMA,EMA technical analysis, forecast prediction, by indicators ADX,MACD,RSI,CCI USA stock exchange
operates under Finance sector & deals in Major Banks
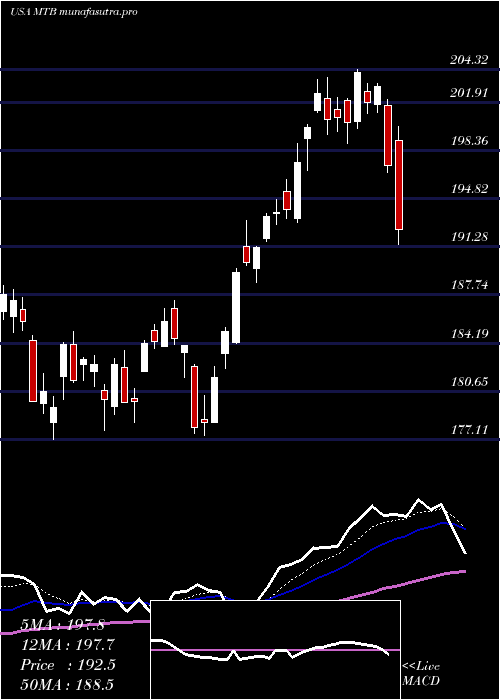
Daily price and charts and targets MT Strong Daily Stock price targets for MT MTB are 195.27 and 197.42 | Daily Target 1 | 193.74 | | Daily Target 2 | 194.65 | | Daily Target 3 | 195.88666666667 | | Daily Target 4 | 196.8 | | Daily Target 5 | 198.04 |
Daily price and volume M T
| Date |
Closing |
Open |
Range |
Volume |
Thu 04 December 2025 |
195.57 (-0.03%) |
195.01 |
194.97 - 197.12 |
0.7226 times |
Wed 03 December 2025 |
195.63 (2.43%) |
190.96 |
189.47 - 195.71 |
0.8618 times |
Tue 02 December 2025 |
190.98 (0.4%) |
191.23 |
190.21 - 192.28 |
1.034 times |
Mon 01 December 2025 |
190.22 (0%) |
188.46 |
187.81 - 191.51 |
1.2309 times |
Fri 28 November 2025 |
190.22 (-0.01%) |
190.13 |
189.76 - 191.33 |
0.5079 times |
Wed 26 November 2025 |
190.24 (-0.7%) |
190.87 |
190.17 - 192.33 |
0.7893 times |
Tue 25 November 2025 |
191.58 (2.13%) |
189.31 |
188.55 - 192.60 |
1.0088 times |
Mon 24 November 2025 |
187.58 (-0.54%) |
188.24 |
185.84 - 188.89 |
1.4013 times |
Fri 21 November 2025 |
188.60 (3.2%) |
184.15 |
183.27 - 190.47 |
1.448 times |
Thu 20 November 2025 |
182.75 (0.07%) |
185.56 |
181.56 - 186.33 |
0.9953 times |
Wed 19 November 2025 |
182.63 (0.29%) |
182.84 |
180.49 - 183.39 |
0.7123 times |
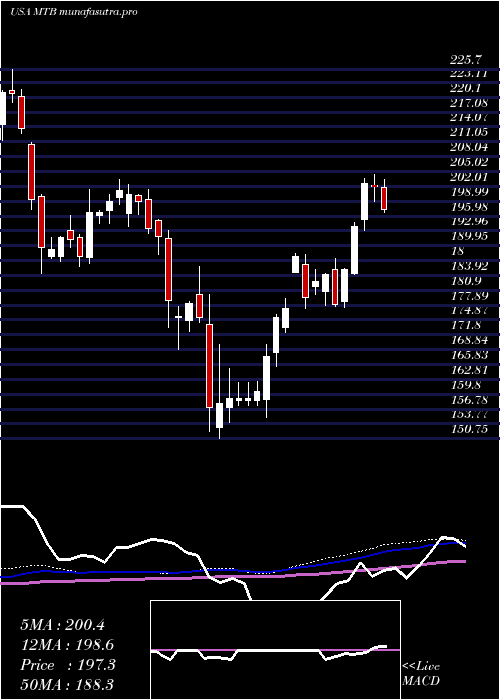
Weekly price and charts MT Strong weekly Stock price targets for MT MTB are 191.69 and 201 | Weekly Target 1 | 184.19 | | Weekly Target 2 | 189.88 | | Weekly Target 3 | 193.5 | | Weekly Target 4 | 199.19 | | Weekly Target 5 | 202.81 |
Weekly price and volumes for M T
| Date |
Closing |
Open |
Range |
Volume |
Thu 04 December 2025 |
195.57 (2.81%) |
188.46 |
187.81 - 197.12 |
0.7063 times |
Fri 28 November 2025 |
190.22 (0.86%) |
188.24 |
185.84 - 192.60 |
0.6803 times |
Fri 21 November 2025 |
188.60 (0.88%) |
186.40 |
179.75 - 190.47 |
0.9693 times |
Fri 14 November 2025 |
186.96 (0.59%) |
185.84 |
184.28 - 191.08 |
1.0107 times |
Fri 07 November 2025 |
185.86 (1.08%) |
182.01 |
180.07 - 185.89 |
0.8018 times |
Fri 31 October 2025 |
183.87 (0%) |
181.26 |
180.23 - 184.36 |
0.1947 times |
Fri 31 October 2025 |
183.87 (-0.73%) |
186.10 |
179.32 - 186.39 |
1.3344 times |
Fri 24 October 2025 |
185.23 (2.52%) |
181.65 |
180.42 - 186.18 |
1.5524 times |
Fri 17 October 2025 |
180.67 (-4.7%) |
182.72 |
174.76 - 188.69 |
2.2969 times |
Tue 07 October 2025 |
189.58 (-2.56%) |
195.42 |
187.00 - 198.87 |
0.4533 times |
Fri 03 October 2025 |
194.56 (-2.79%) |
199.97 |
194.01 - 200.42 |
1.1018 times |
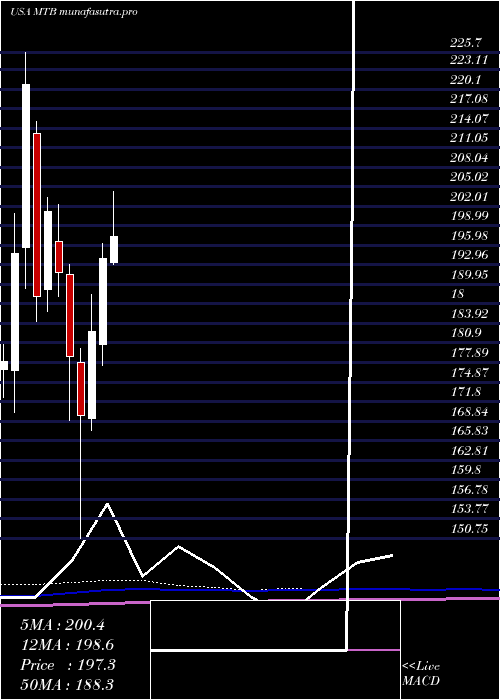
Monthly price and charts MT Strong monthly Stock price targets for MT MTB are 191.69 and 201 | Monthly Target 1 | 184.19 | | Monthly Target 2 | 189.88 | | Monthly Target 3 | 193.5 | | Monthly Target 4 | 199.19 | | Monthly Target 5 | 202.81 |
Monthly price and volumes M T
| Date |
Closing |
Open |
Range |
Volume |
Thu 04 December 2025 |
195.57 (2.81%) |
188.46 |
187.81 - 197.12 |
0.1437 times |
Fri 28 November 2025 |
190.22 (3.45%) |
182.01 |
179.75 - 192.60 |
0.7041 times |
Fri 31 October 2025 |
183.87 (-6.96%) |
196.95 |
174.76 - 198.87 |
1.3183 times |
Tue 30 September 2025 |
197.62 (-2%) |
197.94 |
192.67 - 203.96 |
0.9947 times |
Fri 29 August 2025 |
201.66 (6.87%) |
185.52 |
182.63 - 203.19 |
0.8288 times |
Thu 31 July 2025 |
188.70 (-2.73%) |
193.33 |
188.41 - 204.32 |
1.1381 times |
Mon 30 June 2025 |
193.99 (6.21%) |
180.71 |
177.40 - 196.26 |
1.0628 times |
Fri 30 May 2025 |
182.64 (7.59%) |
169.20 |
167.35 - 188.40 |
1.0555 times |
Wed 30 April 2025 |
169.76 (-5.03%) |
177.84 |
150.75 - 180.01 |
1.2253 times |
Mon 31 March 2025 |
178.75 (-6.77%) |
191.41 |
168.87 - 193.06 |
1.5287 times |
Fri 28 February 2025 |
191.72 (-4.73%) |
196.55 |
188.12 - 202.32 |
0.9505 times |
DMA SMA EMA moving averages of M T MTB
DMA (daily moving average) of M T MTB
| DMA period | DMA value | | 5 day DMA | 192.52 | | 12 day DMA | 189.01 | | 20 day DMA | 187.74 | | 35 day DMA | 185.34 | | 50 day DMA | 188.01 | | 100 day DMA | 191.72 | | 150 day DMA | 189.37 | | 200 day DMA | 185.79 | EMA (exponential moving average) of M T MTB
| EMA period | EMA current | EMA prev | EMA prev2 | | 5 day EMA | 193.1 | 191.87 | 189.99 | | 12 day EMA | 190.34 | 189.39 | 188.25 | | 20 day EMA | 188.9 | 188.2 | 187.42 | | 35 day EMA | 189.02 | 188.63 | 188.22 | | 50 day EMA | 189.34 | 189.09 | 188.82 |
SMA (simple moving average) of M T MTB
| SMA period | SMA current | SMA prev | SMA prev2 | | 5 day SMA | 192.52 | 191.46 | 190.65 | | 12 day SMA | 189.01 | 187.8 | 187.08 | | 20 day SMA | 187.74 | 187.13 | 186.39 | | 35 day SMA | 185.34 | 185.04 | 184.79 | | 50 day SMA | 188.01 | 188.14 | 188.23 | | 100 day SMA | 191.72 | 191.81 | 191.85 | | 150 day SMA | 189.37 | 189.18 | 189 | | 200 day SMA | 185.79 | 185.8 | 185.82 |
|
|
