MicrostrategyIncorporated MSTR full analysis,charts,indicators,moving averages,SMA,DMA,EMA,ADX,MACD,RSIMicrostrategy Incorporated MSTR WideScreen charts, DMA,SMA,EMA technical analysis, forecast prediction, by indicators ADX,MACD,RSI,CCI USA stock exchange
operates under Technology sector & deals in Computer Software Prepackaged Software
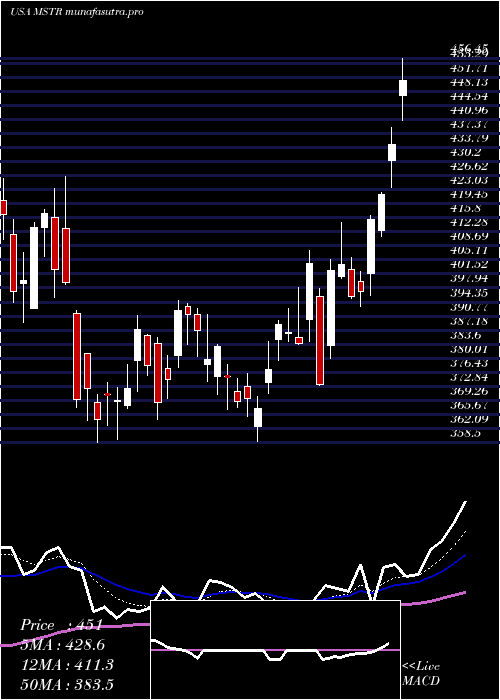
Daily price and charts and targets MicrostrategyIncorporated Strong Daily Stock price targets for MicrostrategyIncorporated MSTR are 296.72 and 311.19 | Daily Target 1 | 285.34 | | Daily Target 2 | 293.62 | | Daily Target 3 | 299.80666666667 | | Daily Target 4 | 308.09 | | Daily Target 5 | 314.28 |
Daily price and volume Microstrategy Incorporated
| Date |
Closing |
Open |
Range |
Volume |
Tue 21 October 2025 |
301.91 (1.79%) |
293.95 |
291.52 - 305.99 |
0.7736 times |
Mon 20 October 2025 |
296.61 (1.82%) |
301.01 |
294.40 - 306.16 |
0.4834 times |
Fri 17 October 2025 |
291.32 (1.86%) |
273.01 |
269.54 - 292.80 |
0.8272 times |
Thu 16 October 2025 |
285.99 (-3.63%) |
297.75 |
282.19 - 302.27 |
0.9131 times |
Wed 15 October 2025 |
296.76 (-1.3%) |
303.60 |
294.62 - 308.88 |
1.0402 times |
Tue 14 October 2025 |
300.67 (-4.69%) |
301.00 |
297.34 - 312.71 |
1.1239 times |
Mon 13 October 2025 |
315.47 (3.5%) |
306.67 |
300.59 - 315.95 |
1.1331 times |
Fri 10 October 2025 |
304.79 (-4.84%) |
323.17 |
303.57 - 323.43 |
1.3356 times |
Thu 09 October 2025 |
320.29 (-3.18%) |
327.40 |
318.22 - 328.99 |
1.0977 times |
Wed 08 October 2025 |
330.80 (0.73%) |
335.61 |
322.30 - 336.36 |
1.2722 times |
Tue 07 October 2025 |
328.40 (-8.52%) |
358.88 |
328.16 - 359.44 |
1.9171 times |
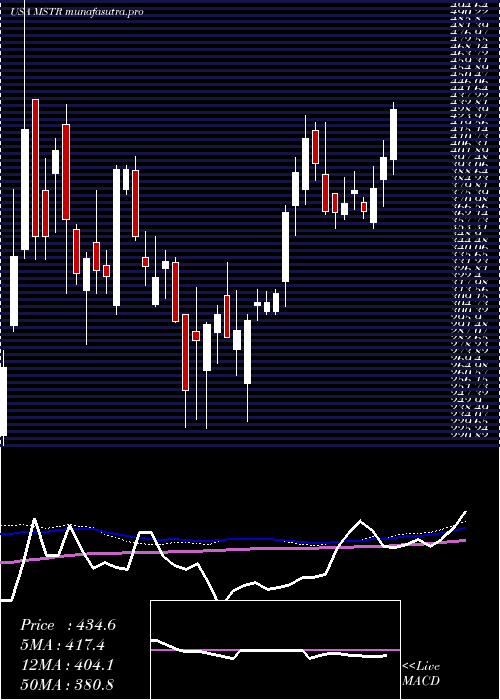
Weekly price and charts MicrostrategyIncorporated Strong weekly Stock price targets for MicrostrategyIncorporated MSTR are 296.72 and 311.36 | Weekly Target 1 | 285.22 | | Weekly Target 2 | 293.57 | | Weekly Target 3 | 299.86333333333 | | Weekly Target 4 | 308.21 | | Weekly Target 5 | 314.5 |
Weekly price and volumes for Microstrategy Incorporated
| Date |
Closing |
Open |
Range |
Volume |
Tue 21 October 2025 |
301.91 (3.64%) |
301.01 |
291.52 - 306.16 |
0.283 times |
Fri 17 October 2025 |
291.32 (-4.42%) |
306.67 |
269.54 - 315.95 |
1.1341 times |
Fri 10 October 2025 |
304.79 (-12.84%) |
360.00 |
303.57 - 365.21 |
1.3953 times |
Fri 03 October 2025 |
349.68 (13.14%) |
313.73 |
311.00 - 358.54 |
1.1491 times |
Fri 26 September 2025 |
309.06 (-10.35%) |
337.02 |
292.36 - 341.59 |
1.3746 times |
Fri 19 September 2025 |
344.75 (4.02%) |
329.40 |
320.45 - 358.25 |
1.4376 times |
Fri 12 September 2025 |
331.44 (-1.32%) |
328.11 |
321.50 - 340.01 |
0.982 times |
Fri 05 September 2025 |
335.87 (0.44%) |
334.93 |
317.75 - 348.60 |
0.9885 times |
Fri 29 August 2025 |
334.41 (0%) |
334.60 |
332.64 - 339.63 |
0.2238 times |
Fri 29 August 2025 |
334.41 (-6.62%) |
344.91 |
332.64 - 351.99 |
1.032 times |
Fri 22 August 2025 |
358.13 (-2.24%) |
359.95 |
325.56 - 367.57 |
1.4722 times |
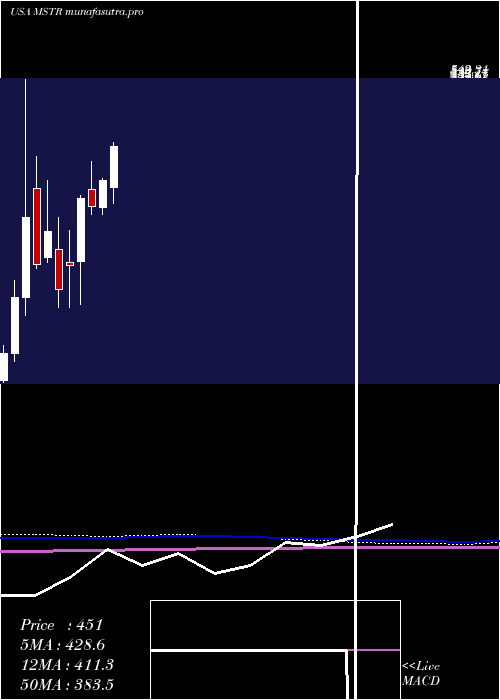
Monthly price and charts MicrostrategyIncorporated Strong monthly Stock price targets for MicrostrategyIncorporated MSTR are 237.89 and 333.56 | Monthly Target 1 | 216.55 | | Monthly Target 2 | 259.23 | | Monthly Target 3 | 312.22 | | Monthly Target 4 | 354.9 | | Monthly Target 5 | 407.89 |
Monthly price and volumes Microstrategy Incorporated
| Date |
Closing |
Open |
Range |
Volume |
Tue 21 October 2025 |
301.91 (-6.3%) |
332.47 |
269.54 - 365.21 |
0.5579 times |
Tue 30 September 2025 |
322.21 (-3.65%) |
334.93 |
292.36 - 358.25 |
0.8316 times |
Fri 29 August 2025 |
334.41 (-16.78%) |
390.40 |
325.56 - 414.36 |
0.8571 times |
Thu 31 July 2025 |
401.86 (-0.59%) |
395.70 |
372.91 - 457.22 |
0.8977 times |
Mon 30 June 2025 |
404.23 (9.53%) |
367.89 |
358.80 - 407.39 |
0.7009 times |
Fri 30 May 2025 |
369.06 (-2.91%) |
392.29 |
358.50 - 430.35 |
1.057 times |
Wed 30 April 2025 |
380.11 (31.86%) |
293.53 |
235.93 - 384.00 |
1.2409 times |
Mon 31 March 2025 |
288.27 (12.86%) |
293.15 |
231.51 - 336.77 |
1.3402 times |
Fri 28 February 2025 |
255.43 (-23.7%) |
310.00 |
231.92 - 353.79 |
1.0265 times |
Fri 31 January 2025 |
334.79 (15.6%) |
300.11 |
292.32 - 404.42 |
1.4902 times |
Tue 31 December 2024 |
289.62 (-18.11%) |
394.00 |
285.01 - 437.61 |
1.2792 times |
DMA SMA EMA moving averages of Microstrategy Incorporated MSTR
DMA (daily moving average) of Microstrategy Incorporated MSTR
| DMA period | DMA value | | 5 day DMA | 294.52 | | 12 day DMA | 311 | | 20 day DMA | 317.68 | | 35 day DMA | 324 | | 50 day DMA | 331.9 | | 100 day DMA | 364.42 | | 150 day DMA | 357.63 | | 200 day DMA | 348.64 | EMA (exponential moving average) of Microstrategy Incorporated MSTR
| EMA period | EMA current | EMA prev | EMA prev2 | | 5 day EMA | 298.81 | 297.26 | 297.58 | | 12 day EMA | 307.19 | 308.15 | 310.25 | | 20 day EMA | 314.54 | 315.87 | 317.9 | | 35 day EMA | 324.98 | 326.34 | 328.09 | | 50 day EMA | 333.41 | 334.69 | 336.24 |
SMA (simple moving average) of Microstrategy Incorporated MSTR
| SMA period | SMA current | SMA prev | SMA prev2 | | 5 day SMA | 294.52 | 294.27 | 298.04 | | 12 day SMA | 311 | 314.98 | 319.59 | | 20 day SMA | 317.68 | 318.98 | 320.94 | | 35 day SMA | 324 | 325.13 | 326.21 | | 50 day SMA | 331.9 | 333.75 | 335.83 | | 100 day SMA | 364.42 | 365.04 | 365.8 | | 150 day SMA | 357.63 | 357.37 | 357.15 | | 200 day SMA | 348.64 | 348.58 | 348.62 |
|
|
