MscIndustrial MSM full analysis,charts,indicators,moving averages,SMA,DMA,EMA,ADX,MACD,RSIMsc Industrial MSM WideScreen charts, DMA,SMA,EMA technical analysis, forecast prediction, by indicators ADX,MACD,RSI,CCI USA stock exchange
operates under Capital Goods sector & deals in Industrial Machinery Components
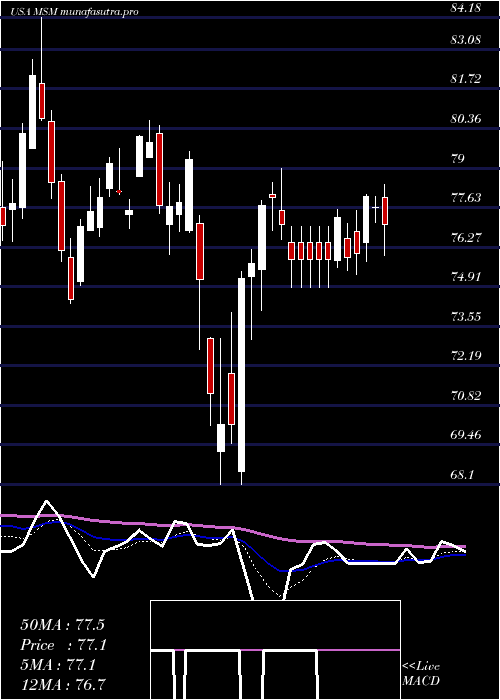
Daily price and charts and targets MscIndustrial Strong Daily Stock price targets for MscIndustrial MSM are 81.4 and 82.93 | Daily Target 1 | 81.05 | | Daily Target 2 | 81.75 | | Daily Target 3 | 82.583333333333 | | Daily Target 4 | 83.28 | | Daily Target 5 | 84.11 |
Daily price and volume Msc Industrial
| Date |
Closing |
Open |
Range |
Volume |
Thu 04 December 2025 |
82.44 (-0.46%) |
82.79 |
81.89 - 83.42 |
1.1939 times |
Wed 03 December 2025 |
82.82 (-3.5%) |
86.17 |
81.74 - 86.25 |
1.7639 times |
Tue 02 December 2025 |
85.82 (-0.39%) |
86.55 |
85.23 - 86.55 |
0.8289 times |
Mon 01 December 2025 |
86.16 (-3.15%) |
88.13 |
84.75 - 88.13 |
1.4464 times |
Fri 28 November 2025 |
88.96 (-0.43%) |
89.76 |
88.62 - 89.76 |
0.2209 times |
Wed 26 November 2025 |
89.34 (1.05%) |
87.86 |
87.86 - 89.92 |
0.5605 times |
Tue 25 November 2025 |
88.41 (1.63%) |
87.52 |
87.03 - 88.60 |
0.5978 times |
Mon 24 November 2025 |
86.99 (-1.26%) |
87.64 |
86.61 - 88.00 |
1.1104 times |
Fri 21 November 2025 |
88.10 (5.5%) |
84.38 |
83.58 - 88.35 |
1.5567 times |
Thu 20 November 2025 |
83.51 (-1.47%) |
85.40 |
82.99 - 85.77 |
0.7205 times |
Wed 19 November 2025 |
84.76 (-0.4%) |
85.78 |
84.13 - 85.78 |
0.8703 times |
Weekly price and charts MscIndustrial Strong weekly Stock price targets for MscIndustrial MSM are 78.9 and 85.29 | Weekly Target 1 | 77.71 | | Weekly Target 2 | 80.08 | | Weekly Target 3 | 84.103333333333 | | Weekly Target 4 | 86.47 | | Weekly Target 5 | 90.49 |
Weekly price and volumes for Msc Industrial
| Date |
Closing |
Open |
Range |
Volume |
Thu 04 December 2025 |
82.44 (-7.33%) |
88.13 |
81.74 - 88.13 |
1.2542 times |
Fri 28 November 2025 |
88.96 (0.98%) |
87.64 |
86.61 - 89.92 |
0.5967 times |
Fri 21 November 2025 |
88.10 (1.69%) |
88.14 |
82.99 - 88.72 |
1.4554 times |
Fri 14 November 2025 |
86.64 (-1.58%) |
88.14 |
86.43 - 90.85 |
1.2867 times |
Fri 07 November 2025 |
88.03 (3.67%) |
85.09 |
85.09 - 88.09 |
0.7949 times |
Fri 31 October 2025 |
84.91 (0%) |
84.84 |
84.28 - 85.35 |
0.2101 times |
Fri 31 October 2025 |
84.91 (-3.51%) |
88.01 |
83.10 - 88.26 |
1.3137 times |
Fri 24 October 2025 |
88.00 (2.44%) |
86.46 |
86.46 - 91.79 |
1.6788 times |
Fri 17 October 2025 |
85.90 (-4.81%) |
85.99 |
84.20 - 87.56 |
1.1607 times |
Tue 07 October 2025 |
90.24 (-1.9%) |
92.17 |
89.63 - 92.85 |
0.2487 times |
Fri 03 October 2025 |
91.99 (1.17%) |
91.58 |
90.27 - 92.93 |
0.7786 times |
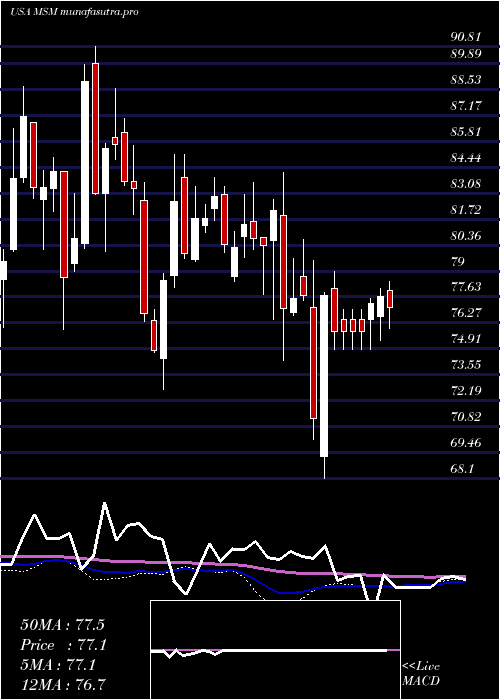
Monthly price and charts MscIndustrial Strong monthly Stock price targets for MscIndustrial MSM are 78.9 and 85.29 | Monthly Target 1 | 77.71 | | Monthly Target 2 | 80.08 | | Monthly Target 3 | 84.103333333333 | | Monthly Target 4 | 86.47 | | Monthly Target 5 | 90.49 |
Monthly price and volumes Msc Industrial
| Date |
Closing |
Open |
Range |
Volume |
Thu 04 December 2025 |
82.44 (-7.33%) |
88.13 |
81.74 - 88.13 |
0.3137 times |
Fri 28 November 2025 |
88.96 (4.77%) |
85.09 |
82.99 - 90.85 |
1.0341 times |
Fri 31 October 2025 |
84.91 (-7.85%) |
91.46 |
83.10 - 92.93 |
1.2627 times |
Tue 30 September 2025 |
92.14 (2.12%) |
89.37 |
88.43 - 94.31 |
1.0329 times |
Fri 29 August 2025 |
90.23 (4.17%) |
85.00 |
83.96 - 92.00 |
0.7284 times |
Thu 31 July 2025 |
86.62 (1.88%) |
89.07 |
83.63 - 92.68 |
1.5963 times |
Mon 30 June 2025 |
85.02 (4.7%) |
80.98 |
79.07 - 85.94 |
0.904 times |
Fri 30 May 2025 |
81.20 (6.17%) |
76.57 |
74.30 - 84.25 |
0.7941 times |
Wed 30 April 2025 |
76.48 (-1.53%) |
77.41 |
68.10 - 79.57 |
1.2881 times |
Mon 31 March 2025 |
77.67 (-3.35%) |
80.62 |
74.32 - 84.18 |
1.0457 times |
Fri 28 February 2025 |
80.36 (-0.06%) |
78.70 |
77.75 - 83.67 |
0.8038 times |

DMA SMA EMA moving averages of Msc Industrial MSM
DMA (daily moving average) of Msc Industrial MSM
| DMA period | DMA value | | 5 day DMA | 85.24 | | 12 day DMA | 86.03 | | 20 day DMA | 86.76 | | 35 day DMA | 86.53 | | 50 day DMA | 87.56 | | 100 day DMA | 88.25 | | 150 day DMA | 86.06 | | 200 day DMA | 83.97 | EMA (exponential moving average) of Msc Industrial MSM
| EMA period | EMA current | EMA prev | EMA prev2 | | 5 day EMA | 84.53 | 85.58 | 86.96 | | 12 day EMA | 85.8 | 86.41 | 87.06 | | 20 day EMA | 86.29 | 86.7 | 87.11 | | 35 day EMA | 87.11 | 87.39 | 87.66 | | 50 day EMA | 87.65 | 87.86 | 88.07 |
SMA (simple moving average) of Msc Industrial MSM
| SMA period | SMA current | SMA prev | SMA prev2 | | 5 day SMA | 85.24 | 86.62 | 87.74 | | 12 day SMA | 86.03 | 86.31 | 86.63 | | 20 day SMA | 86.76 | 86.97 | 87.15 | | 35 day SMA | 86.53 | 86.61 | 86.73 | | 50 day SMA | 87.56 | 87.73 | 87.93 | | 100 day SMA | 88.25 | 88.34 | 88.42 | | 150 day SMA | 86.06 | 86.03 | 86 | | 200 day SMA | 83.97 | 83.97 | 83.96 |
|
|
