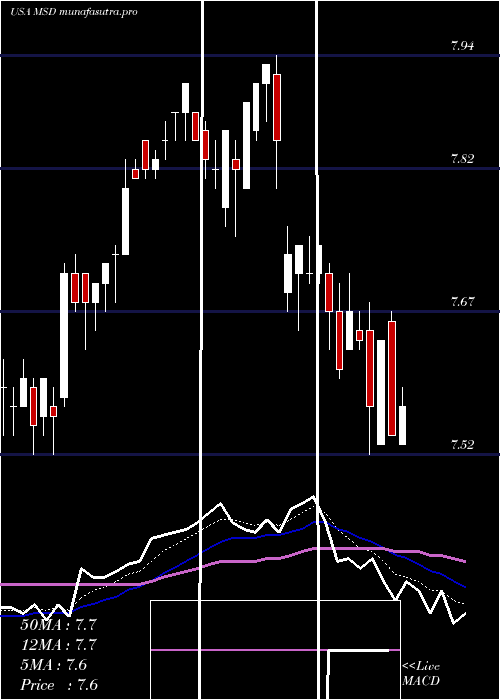
MorganStanley MSD full analysis,charts,indicators,moving averages,SMA,DMA,EMA,ADX,MACD,RSIMorgan Stanley MSD WideScreen charts, DMA,SMA,EMA technical analysis, forecast prediction, by indicators ADX,MACD,RSI,CCI USA stock exchange
operates under N A sector & deals in N A
Daily price and charts and targets MorganStanley Strong Daily Stock price targets for MorganStanley MSD are 7.38 and 7.51 | Daily Target 1 | 7.28 | | Daily Target 2 | 7.35 | | Daily Target 3 | 7.4066666666667 | | Daily Target 4 | 7.48 | | Daily Target 5 | 7.54 |
Daily price and volume Morgan Stanley
| Date |
Closing |
Open |
Range |
Volume |
Tue 21 October 2025 |
7.43 (1.36%) |
7.33 |
7.33 - 7.46 |
0.7461 times |
Mon 20 October 2025 |
7.33 (0.41%) |
7.30 |
7.26 - 7.34 |
0.8871 times |
Fri 17 October 2025 |
7.30 (0.97%) |
7.25 |
7.23 - 7.30 |
0.8925 times |
Thu 16 October 2025 |
7.23 (-0.82%) |
7.31 |
7.22 - 7.33 |
0.8744 times |
Wed 15 October 2025 |
7.29 (0.14%) |
7.31 |
7.27 - 7.34 |
1.2874 times |
Tue 14 October 2025 |
7.28 (0.28%) |
7.27 |
7.23 - 7.28 |
0.8125 times |
Mon 13 October 2025 |
7.26 (0.28%) |
7.25 |
7.25 - 7.29 |
0.6624 times |
Fri 10 October 2025 |
7.24 (-0.96%) |
7.33 |
7.24 - 7.33 |
1.2556 times |
Thu 09 October 2025 |
7.31 (-0.68%) |
7.34 |
7.29 - 7.36 |
1.7096 times |
Wed 08 October 2025 |
7.36 (0.14%) |
7.38 |
7.33 - 7.38 |
0.8725 times |
Tue 07 October 2025 |
7.35 (-0.27%) |
7.38 |
7.34 - 7.43 |
0.9444 times |
Weekly price and charts MorganStanley Strong weekly Stock price targets for MorganStanley MSD are 7.35 and 7.55 | Weekly Target 1 | 7.18 | | Weekly Target 2 | 7.31 | | Weekly Target 3 | 7.3833333333333 | | Weekly Target 4 | 7.51 | | Weekly Target 5 | 7.58 |
Weekly price and volumes for Morgan Stanley
| Date |
Closing |
Open |
Range |
Volume |
Tue 21 October 2025 |
7.43 (1.78%) |
7.30 |
7.26 - 7.46 |
0.375 times |
Fri 17 October 2025 |
7.30 (0.83%) |
7.25 |
7.22 - 7.34 |
1.04 times |
Fri 10 October 2025 |
7.24 (-2.03%) |
7.39 |
7.24 - 7.43 |
1.2445 times |
Fri 03 October 2025 |
7.39 (-1.6%) |
7.50 |
7.29 - 7.54 |
1.3815 times |
Fri 26 September 2025 |
7.51 (-1.83%) |
7.65 |
7.48 - 7.67 |
1.0709 times |
Fri 19 September 2025 |
7.65 (1.73%) |
7.52 |
7.51 - 7.69 |
1.2142 times |
Fri 12 September 2025 |
7.52 (-0.13%) |
7.53 |
7.47 - 7.58 |
1.2016 times |
Fri 05 September 2025 |
7.53 (0.13%) |
7.45 |
7.42 - 7.55 |
1.0945 times |
Fri 29 August 2025 |
7.52 (0%) |
7.49 |
7.47 - 7.54 |
0.2229 times |
Fri 29 August 2025 |
7.52 (0.8%) |
7.43 |
7.42 - 7.54 |
1.1551 times |
Fri 22 August 2025 |
7.46 (0.4%) |
7.42 |
7.40 - 7.48 |
1.0826 times |

Monthly price and charts MorganStanley Strong monthly Stock price targets for MorganStanley MSD are 7.33 and 7.57 | Monthly Target 1 | 7.13 | | Monthly Target 2 | 7.28 | | Monthly Target 3 | 7.37 | | Monthly Target 4 | 7.52 | | Monthly Target 5 | 7.61 |
Monthly price and volumes Morgan Stanley
| Date |
Closing |
Open |
Range |
Volume |
Tue 21 October 2025 |
7.43 (0.81%) |
7.36 |
7.22 - 7.46 |
0.9056 times |
Tue 30 September 2025 |
7.37 (-1.99%) |
7.45 |
7.29 - 7.69 |
1.4417 times |
Fri 29 August 2025 |
7.52 (0.94%) |
7.46 |
7.39 - 7.54 |
1.2042 times |
Thu 31 July 2025 |
7.45 (-3.62%) |
7.71 |
7.41 - 7.75 |
1.0413 times |
Mon 30 June 2025 |
7.73 (0.39%) |
7.70 |
7.67 - 7.94 |
0.6933 times |
Fri 30 May 2025 |
7.70 (0.65%) |
7.70 |
7.42 - 7.73 |
0.8526 times |
Wed 30 April 2025 |
7.65 (-4.97%) |
8.04 |
6.91 - 8.10 |
1.2071 times |
Mon 31 March 2025 |
8.05 (-2.31%) |
8.24 |
7.84 - 8.32 |
0.845 times |
Fri 28 February 2025 |
8.24 (2.74%) |
7.98 |
7.94 - 8.24 |
0.7574 times |
Fri 31 January 2025 |
8.02 (4.16%) |
7.65 |
7.55 - 8.06 |
1.0518 times |
Tue 31 December 2024 |
7.70 (0.39%) |
7.93 |
7.30 - 8.08 |
1.0163 times |

DMA SMA EMA moving averages of Morgan Stanley MSD
DMA (daily moving average) of Morgan Stanley MSD
| DMA period | DMA value | | 5 day DMA | 7.32 | | 12 day DMA | 7.31 | | 20 day DMA | 7.37 | | 35 day DMA | 7.45 | | 50 day DMA | 7.45 | | 100 day DMA | 7.56 | | 150 day DMA | 7.58 | | 200 day DMA | 7.69 | EMA (exponential moving average) of Morgan Stanley MSD
| EMA period | EMA current | EMA prev | EMA prev2 | | 5 day EMA | 7.34 | 7.3 | 7.28 | | 12 day EMA | 7.34 | 7.32 | 7.32 | | 20 day EMA | 7.37 | 7.36 | 7.36 | | 35 day EMA | 7.38 | 7.38 | 7.38 | | 50 day EMA | 7.44 | 7.44 | 7.44 |
SMA (simple moving average) of Morgan Stanley MSD
| SMA period | SMA current | SMA prev | SMA prev2 | | 5 day SMA | 7.32 | 7.29 | 7.27 | | 12 day SMA | 7.31 | 7.31 | 7.31 | | 20 day SMA | 7.37 | 7.37 | 7.39 | | 35 day SMA | 7.45 | 7.45 | 7.46 | | 50 day SMA | 7.45 | 7.45 | 7.46 | | 100 day SMA | 7.56 | 7.56 | 7.56 | | 150 day SMA | 7.58 | 7.58 | 7.59 | | 200 day SMA | 7.69 | 7.69 | 7.69 |
|
|
