MidlandStates MSBI full analysis,charts,indicators,moving averages,SMA,DMA,EMA,ADX,MACD,RSIMidland States MSBI WideScreen charts, DMA,SMA,EMA technical analysis, forecast prediction, by indicators ADX,MACD,RSI,CCI USA stock exchange
operates under Finance sector & deals in Major Banks
Daily price and charts and targets MidlandStates Strong Daily Stock price targets for MidlandStates MSBI are 19.35 and 20.9 | Daily Target 1 | 18.1 | | Daily Target 2 | 19.05 | | Daily Target 3 | 19.646666666667 | | Daily Target 4 | 20.6 | | Daily Target 5 | 21.2 |
Daily price and volume Midland States
| Date |
Closing |
Open |
Range |
Volume |
Thu 04 December 2025 |
20.01 (6.49%) |
18.69 |
18.69 - 20.24 |
2.1558 times |
Wed 03 December 2025 |
18.79 (7.07%) |
17.64 |
17.53 - 19.04 |
2.3682 times |
Tue 02 December 2025 |
17.55 (5.98%) |
16.74 |
16.74 - 17.71 |
1.4958 times |
Mon 01 December 2025 |
16.56 (1.85%) |
16.17 |
16.17 - 16.85 |
0.8654 times |
Fri 28 November 2025 |
16.26 (0.68%) |
16.23 |
16.11 - 16.36 |
0.3291 times |
Wed 26 November 2025 |
16.15 (-0.86%) |
16.19 |
16.07 - 16.46 |
0.6034 times |
Tue 25 November 2025 |
16.29 (4.36%) |
15.62 |
15.62 - 16.38 |
0.5796 times |
Mon 24 November 2025 |
15.61 (-1.39%) |
15.74 |
15.57 - 15.80 |
0.444 times |
Fri 21 November 2025 |
15.83 (4.21%) |
15.22 |
15.22 - 15.95 |
0.6675 times |
Thu 20 November 2025 |
15.19 (-0.78%) |
15.44 |
15.11 - 15.71 |
0.4912 times |
Wed 19 November 2025 |
15.31 (0.86%) |
15.28 |
15.06 - 15.36 |
0.5911 times |
Weekly price and charts MidlandStates Strong weekly Stock price targets for MidlandStates MSBI are 18.09 and 22.16 | Weekly Target 1 | 14.74 | | Weekly Target 2 | 17.37 | | Weekly Target 3 | 18.806666666667 | | Weekly Target 4 | 21.44 | | Weekly Target 5 | 22.88 |
Weekly price and volumes for Midland States
| Date |
Closing |
Open |
Range |
Volume |
Thu 04 December 2025 |
20.01 (23.06%) |
16.17 |
16.17 - 20.24 |
2.0281 times |
Fri 28 November 2025 |
16.26 (2.72%) |
15.74 |
15.57 - 16.46 |
0.5762 times |
Fri 21 November 2025 |
15.83 (-2.1%) |
16.10 |
15.06 - 16.17 |
0.9239 times |
Fri 14 November 2025 |
16.17 (1%) |
16.19 |
15.68 - 16.39 |
1.0528 times |
Fri 07 November 2025 |
16.01 (9.36%) |
15.99 |
15.72 - 16.41 |
1.0335 times |
Fri 31 October 2025 |
14.64 (0%) |
15.60 |
14.24 - 15.84 |
0.3321 times |
Fri 31 October 2025 |
14.64 (-13.78%) |
17.10 |
14.24 - 17.10 |
1.0911 times |
Fri 24 October 2025 |
16.98 (7.26%) |
15.93 |
15.92 - 17.02 |
0.9604 times |
Fri 17 October 2025 |
15.83 (-0.44%) |
16.14 |
15.45 - 16.86 |
1.1419 times |
Fri 10 October 2025 |
15.90 (-5.53%) |
17.00 |
15.87 - 17.18 |
0.8601 times |
Fri 03 October 2025 |
16.83 (-4.1%) |
17.64 |
16.61 - 17.64 |
0.6297 times |

Monthly price and charts MidlandStates Strong monthly Stock price targets for MidlandStates MSBI are 18.09 and 22.16 | Monthly Target 1 | 14.74 | | Monthly Target 2 | 17.37 | | Monthly Target 3 | 18.806666666667 | | Monthly Target 4 | 21.44 | | Monthly Target 5 | 22.88 |
Monthly price and volumes Midland States
| Date |
Closing |
Open |
Range |
Volume |
Thu 04 December 2025 |
20.01 (23.06%) |
16.17 |
16.17 - 20.24 |
0.6051 times |
Fri 28 November 2025 |
16.26 (11.07%) |
15.99 |
15.06 - 16.46 |
1.07 times |
Fri 31 October 2025 |
14.64 (-14.59%) |
16.99 |
14.24 - 17.25 |
1.4001 times |
Tue 30 September 2025 |
17.14 (-6.95%) |
18.23 |
16.92 - 18.89 |
1.0883 times |
Fri 29 August 2025 |
18.42 (8.61%) |
16.79 |
16.30 - 18.70 |
0.9919 times |
Thu 31 July 2025 |
16.96 (-2.08%) |
17.21 |
16.92 - 19.03 |
0.9537 times |
Mon 30 June 2025 |
17.32 (2.61%) |
16.86 |
16.13 - 17.96 |
1.0029 times |
Fri 30 May 2025 |
16.88 (3.69%) |
17.24 |
16.29 - 18.97 |
1.1063 times |
Wed 30 April 2025 |
16.28 (-4.91%) |
17.04 |
14.79 - 17.28 |
1.0387 times |
Mon 31 March 2025 |
17.12 (-11.66%) |
19.42 |
17.09 - 19.60 |
0.743 times |
Fri 28 February 2025 |
19.38 (0.62%) |
18.84 |
18.55 - 20.18 |
0.8479 times |

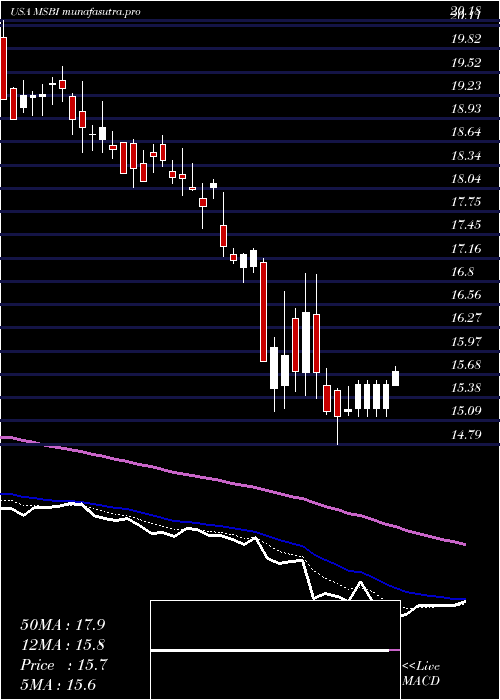
DMA SMA EMA moving averages of Midland States MSBI
DMA (daily moving average) of Midland States MSBI
| DMA period | DMA value | | 5 day DMA | 17.83 | | 12 day DMA | 16.56 | | 20 day DMA | 16.33 | | 35 day DMA | 16.21 | | 50 day DMA | 16.37 | | 100 day DMA | 17.15 | | 150 day DMA | 17.3 | | 200 day DMA | 17.34 | EMA (exponential moving average) of Midland States MSBI
| EMA period | EMA current | EMA prev | EMA prev2 | | 5 day EMA | 18.25 | 17.37 | 16.66 | | 12 day EMA | 17.15 | 16.63 | 16.24 | | 20 day EMA | 16.73 | 16.39 | 16.14 | | 35 day EMA | 16.6 | 16.4 | 16.26 | | 50 day EMA | 16.67 | 16.53 | 16.44 |
SMA (simple moving average) of Midland States MSBI
| SMA period | SMA current | SMA prev | SMA prev2 | | 5 day SMA | 17.83 | 17.06 | 16.56 | | 12 day SMA | 16.56 | 16.17 | 15.95 | | 20 day SMA | 16.33 | 16.12 | 15.99 | | 35 day SMA | 16.21 | 16.11 | 16.04 | | 50 day SMA | 16.37 | 16.32 | 16.3 | | 100 day SMA | 17.15 | 17.14 | 17.14 | | 150 day SMA | 17.3 | 17.27 | 17.26 | | 200 day SMA | 17.34 | 17.33 | 17.34 |
|
|
