MsaSafety MSA full analysis,charts,indicators,moving averages,SMA,DMA,EMA,ADX,MACD,RSIMsa Safety MSA WideScreen charts, DMA,SMA,EMA technical analysis, forecast prediction, by indicators ADX,MACD,RSI,CCI USA stock exchange
operates under Health Care sector & deals in Industrial Specialties
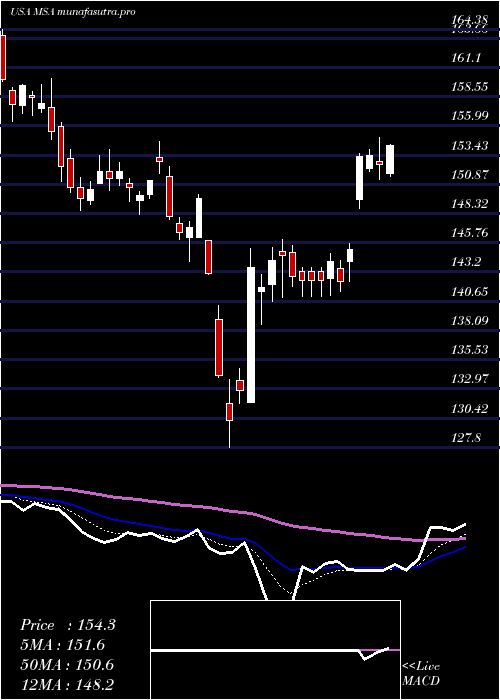
Daily price and charts and targets MsaSafety Strong Daily Stock price targets for MsaSafety MSA are 162.15 and 166.65 | Daily Target 1 | 158.8 | | Daily Target 2 | 161 | | Daily Target 3 | 163.29666666667 | | Daily Target 4 | 165.5 | | Daily Target 5 | 167.8 |
Daily price and volume Msa Safety
| Date |
Closing |
Open |
Range |
Volume |
Thu 04 December 2025 |
163.21 (0.06%) |
163.11 |
161.09 - 165.59 |
1.7305 times |
Wed 03 December 2025 |
163.12 (-0.74%) |
164.59 |
163.04 - 167.54 |
1.1674 times |
Tue 02 December 2025 |
164.34 (0.46%) |
164.40 |
161.70 - 165.34 |
0.9918 times |
Mon 01 December 2025 |
163.58 (1.41%) |
160.11 |
159.78 - 164.50 |
1.3246 times |
Fri 28 November 2025 |
161.30 (0.21%) |
160.62 |
160.62 - 161.90 |
0.4002 times |
Wed 26 November 2025 |
160.96 (-0.04%) |
159.35 |
159.35 - 162.01 |
1.1112 times |
Tue 25 November 2025 |
161.03 (4.52%) |
155.36 |
155.18 - 161.41 |
1.0195 times |
Mon 24 November 2025 |
154.07 (-1.14%) |
155.00 |
153.04 - 155.41 |
0.9004 times |
Fri 21 November 2025 |
155.85 (1.9%) |
153.64 |
153.64 - 157.29 |
0.7241 times |
Thu 20 November 2025 |
152.94 (-2.04%) |
158.02 |
152.86 - 158.68 |
0.6301 times |
Wed 19 November 2025 |
156.13 (-0.5%) |
156.96 |
155.71 - 157.93 |
0.6889 times |
Weekly price and charts MsaSafety Strong weekly Stock price targets for MsaSafety MSA are 161.5 and 169.26 | Weekly Target 1 | 155.75 | | Weekly Target 2 | 159.48 | | Weekly Target 3 | 163.51 | | Weekly Target 4 | 167.24 | | Weekly Target 5 | 171.27 |
Weekly price and volumes for Msa Safety
| Date |
Closing |
Open |
Range |
Volume |
Thu 04 December 2025 |
163.21 (1.18%) |
160.11 |
159.78 - 167.54 |
1.3481 times |
Fri 28 November 2025 |
161.30 (3.5%) |
155.00 |
153.04 - 162.01 |
0.8871 times |
Fri 21 November 2025 |
155.85 (-0.28%) |
156.17 |
152.86 - 158.68 |
0.9052 times |
Fri 14 November 2025 |
156.29 (-1.68%) |
160.14 |
155.85 - 161.99 |
0.895 times |
Fri 07 November 2025 |
158.96 (1.23%) |
154.74 |
154.74 - 161.28 |
0.8468 times |
Fri 31 October 2025 |
157.03 (0%) |
156.75 |
154.72 - 157.83 |
0.3652 times |
Fri 31 October 2025 |
157.03 (-6.64%) |
168.96 |
154.72 - 173.64 |
2.0696 times |
Fri 24 October 2025 |
168.20 (1.9%) |
165.84 |
164.20 - 169.78 |
1.0191 times |
Fri 17 October 2025 |
165.07 (-3.22%) |
171.49 |
164.10 - 171.72 |
1.0526 times |
Fri 10 October 2025 |
170.57 (-1.97%) |
174.10 |
169.53 - 177.20 |
0.6113 times |
Fri 03 October 2025 |
174.00 (1.83%) |
171.40 |
169.91 - 174.99 |
0.8756 times |
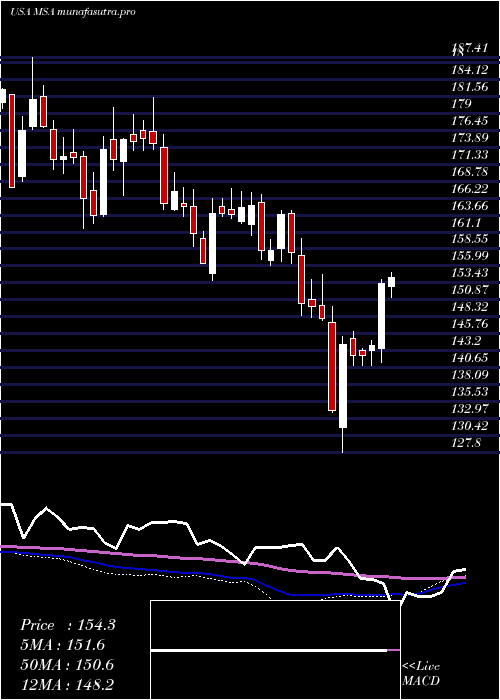
Monthly price and charts MsaSafety Strong monthly Stock price targets for MsaSafety MSA are 161.5 and 169.26 | Monthly Target 1 | 155.75 | | Monthly Target 2 | 159.48 | | Monthly Target 3 | 163.51 | | Monthly Target 4 | 167.24 | | Monthly Target 5 | 171.27 |
Monthly price and volumes Msa Safety
| Date |
Closing |
Open |
Range |
Volume |
Thu 04 December 2025 |
163.21 (1.18%) |
160.11 |
159.78 - 167.54 |
0.3196 times |
Fri 28 November 2025 |
161.30 (2.72%) |
154.74 |
152.86 - 162.01 |
0.8379 times |
Fri 31 October 2025 |
157.03 (-8.74%) |
171.26 |
154.72 - 177.20 |
1.3111 times |
Tue 30 September 2025 |
172.07 (0.86%) |
168.94 |
166.79 - 173.94 |
1.2616 times |
Fri 29 August 2025 |
170.60 (-4.09%) |
175.45 |
167.63 - 182.86 |
1.0833 times |
Thu 31 July 2025 |
177.87 (6.17%) |
166.82 |
165.94 - 181.05 |
0.9251 times |
Mon 30 June 2025 |
167.53 (2.8%) |
162.23 |
161.08 - 170.11 |
1.0545 times |
Fri 30 May 2025 |
162.97 (3.53%) |
156.85 |
154.52 - 164.68 |
1.1133 times |
Wed 30 April 2025 |
157.42 (7.31%) |
146.20 |
127.86 - 159.24 |
1.2545 times |
Mon 31 March 2025 |
146.69 (-10.39%) |
163.88 |
146.01 - 164.38 |
0.839 times |
Fri 28 February 2025 |
163.70 (-0.63%) |
162.25 |
156.06 - 167.00 |
0.6937 times |

DMA SMA EMA moving averages of Msa Safety MSA
DMA (daily moving average) of Msa Safety MSA
| DMA period | DMA value | | 5 day DMA | 163.11 | | 12 day DMA | 159.45 | | 20 day DMA | 159.13 | | 35 day DMA | 161.01 | | 50 day DMA | 164.1 | | 100 day DMA | 168.47 | | 150 day DMA | 167.1 | | 200 day DMA | 163.02 | EMA (exponential moving average) of Msa Safety MSA
| EMA period | EMA current | EMA prev | EMA prev2 | | 5 day EMA | 162.64 | 162.35 | 161.96 | | 12 day EMA | 160.96 | 160.55 | 160.08 | | 20 day EMA | 160.69 | 160.43 | 160.15 | | 35 day EMA | 162.32 | 162.27 | 162.22 | | 50 day EMA | 164.58 | 164.64 | 164.7 |
SMA (simple moving average) of Msa Safety MSA
| SMA period | SMA current | SMA prev | SMA prev2 | | 5 day SMA | 163.11 | 162.66 | 162.24 | | 12 day SMA | 159.45 | 158.82 | 158.25 | | 20 day SMA | 159.13 | 158.97 | 158.68 | | 35 day SMA | 161.01 | 161.13 | 161.26 | | 50 day SMA | 164.1 | 164.23 | 164.4 | | 100 day SMA | 168.47 | 168.55 | 168.65 | | 150 day SMA | 167.1 | 167.06 | 167 | | 200 day SMA | 163.02 | 162.99 | 162.99 |
|
|
