MorganStanley MS full analysis,charts,indicators,moving averages,SMA,DMA,EMA,ADX,MACD,RSIMorgan Stanley MS WideScreen charts, DMA,SMA,EMA technical analysis, forecast prediction, by indicators ADX,MACD,RSI,CCI USA stock exchange
operates under Finance sector & deals in Investment Bankers Brokers Service
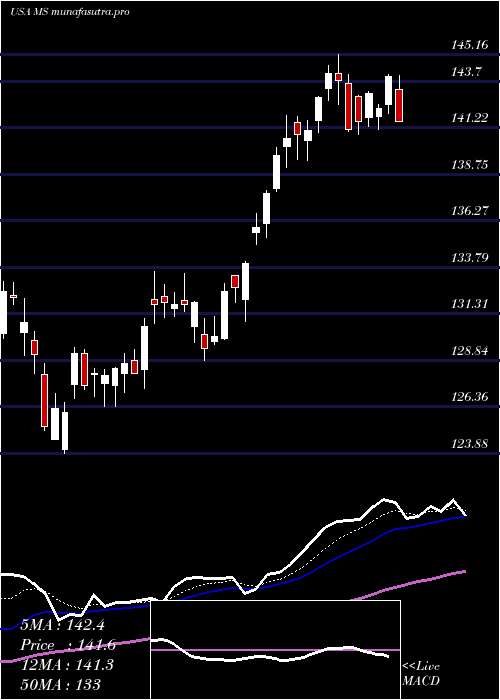
Daily price and charts and targets MorganStanley Strong Daily Stock price targets for MorganStanley MS are 175.41 and 178.43 | Daily Target 1 | 173.02 | | Daily Target 2 | 174.77 | | Daily Target 3 | 176.04333333333 | | Daily Target 4 | 177.79 | | Daily Target 5 | 179.06 |
Daily price and volume Morgan Stanley
| Date |
Closing |
Open |
Range |
Volume |
Fri 05 December 2025 |
176.51 (0.91%) |
174.47 |
174.30 - 177.32 |
0.8684 times |
Thu 04 December 2025 |
174.91 (0.69%) |
174.39 |
173.69 - 176.00 |
0.4064 times |
Wed 03 December 2025 |
173.72 (2.74%) |
168.55 |
168.10 - 174.00 |
1.1642 times |
Tue 02 December 2025 |
169.09 (0.37%) |
168.88 |
168.69 - 170.12 |
0.8117 times |
Mon 01 December 2025 |
168.47 (-0.7%) |
169.01 |
167.73 - 169.77 |
0.8218 times |
Fri 28 November 2025 |
169.66 (1.02%) |
168.00 |
167.76 - 170.27 |
0.3991 times |
Wed 26 November 2025 |
167.94 (1.52%) |
166.98 |
165.87 - 168.96 |
0.9062 times |
Tue 25 November 2025 |
165.43 (1.6%) |
163.51 |
160.62 - 165.87 |
1.0403 times |
Mon 24 November 2025 |
162.83 (2.95%) |
161.33 |
158.99 - 164.46 |
1.8943 times |
Fri 21 November 2025 |
158.17 (-0.33%) |
159.78 |
155.23 - 160.11 |
1.6876 times |
Thu 20 November 2025 |
158.70 (-2.21%) |
164.20 |
158.51 - 166.94 |
0.9837 times |
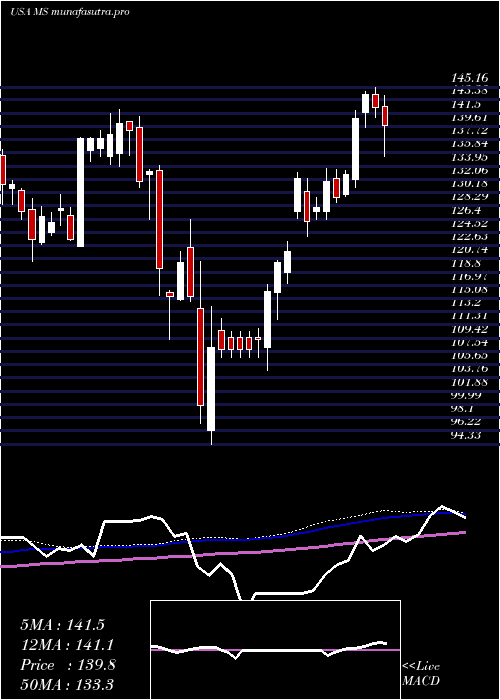
Weekly price and charts MorganStanley Strong weekly Stock price targets for MorganStanley MS are 172.12 and 181.71 | Weekly Target 1 | 164.26 | | Weekly Target 2 | 170.39 | | Weekly Target 3 | 173.85333333333 | | Weekly Target 4 | 179.98 | | Weekly Target 5 | 183.44 |
Weekly price and volumes for Morgan Stanley
| Date |
Closing |
Open |
Range |
Volume |
Fri 05 December 2025 |
176.51 (4.04%) |
169.01 |
167.73 - 177.32 |
1.016 times |
Fri 28 November 2025 |
169.66 (7.26%) |
161.33 |
158.99 - 170.27 |
1.0578 times |
Fri 21 November 2025 |
158.17 (-3.47%) |
163.24 |
155.23 - 166.94 |
1.4601 times |
Fri 14 November 2025 |
163.86 (0.92%) |
163.81 |
159.94 - 171.77 |
1.0021 times |
Fri 07 November 2025 |
162.36 (-1%) |
161.52 |
158.06 - 166.93 |
0.6692 times |
Fri 31 October 2025 |
164.00 (0%) |
163.35 |
162.91 - 164.90 |
0.2485 times |
Fri 31 October 2025 |
164.00 (0.09%) |
164.96 |
162.91 - 167.13 |
1.1156 times |
Fri 24 October 2025 |
163.86 (3.27%) |
159.50 |
157.22 - 164.90 |
0.9745 times |
Fri 17 October 2025 |
158.67 (1.73%) |
154.28 |
151.88 - 166.77 |
2.094 times |
Tue 07 October 2025 |
155.97 (-1.03%) |
158.53 |
155.01 - 159.29 |
0.3623 times |
Fri 03 October 2025 |
157.59 (-1.57%) |
160.69 |
153.71 - 162.23 |
1.1006 times |
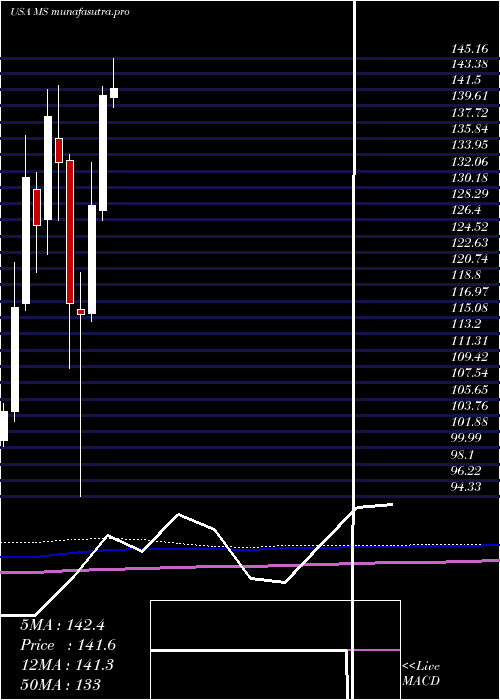
Monthly price and charts MorganStanley Strong monthly Stock price targets for MorganStanley MS are 172.12 and 181.71 | Monthly Target 1 | 164.26 | | Monthly Target 2 | 170.39 | | Monthly Target 3 | 173.85333333333 | | Monthly Target 4 | 179.98 | | Monthly Target 5 | 183.44 |
Monthly price and volumes Morgan Stanley
| Date |
Closing |
Open |
Range |
Volume |
Fri 05 December 2025 |
176.51 (4.04%) |
169.01 |
167.73 - 177.32 |
0.1919 times |
Fri 28 November 2025 |
169.66 (3.45%) |
161.52 |
155.23 - 171.77 |
0.7912 times |
Fri 31 October 2025 |
164.00 (3.17%) |
157.88 |
151.88 - 167.13 |
1.0277 times |
Tue 30 September 2025 |
158.96 (5.64%) |
148.56 |
145.65 - 163.98 |
1.0407 times |
Fri 29 August 2025 |
150.48 (5.63%) |
139.27 |
136.17 - 150.75 |
0.8224 times |
Thu 31 July 2025 |
142.46 (1.14%) |
140.55 |
135.27 - 145.48 |
1.0898 times |
Mon 30 June 2025 |
140.86 (10.02%) |
127.48 |
126.36 - 141.90 |
0.9038 times |
Fri 30 May 2025 |
128.03 (10.93%) |
115.54 |
114.67 - 133.03 |
1.1036 times |
Wed 30 April 2025 |
115.42 (-1.07%) |
115.99 |
94.33 - 120.35 |
1.5838 times |
Mon 31 March 2025 |
116.67 (-12.35%) |
133.33 |
109.22 - 133.99 |
1.4451 times |
Fri 28 February 2025 |
133.11 (-3.84%) |
135.81 |
126.38 - 142.03 |
0.9433 times |
DMA SMA EMA moving averages of Morgan Stanley MS
DMA (daily moving average) of Morgan Stanley MS
| DMA period | DMA value | | 5 day DMA | 172.54 | | 12 day DMA | 167.31 | | 20 day DMA | 166.01 | | 35 day DMA | 164.64 | | 50 day DMA | 162.75 | | 100 day DMA | 154.99 | | 150 day DMA | 146.93 | | 200 day DMA | 139.48 | EMA (exponential moving average) of Morgan Stanley MS
| EMA period | EMA current | EMA prev | EMA prev2 | | 5 day EMA | 173.1 | 171.4 | 169.65 | | 12 day EMA | 169.38 | 168.09 | 166.85 | | 20 day EMA | 167.34 | 166.37 | 165.47 | | 35 day EMA | 164.97 | 164.29 | 163.67 | | 50 day EMA | 163.4 | 162.87 | 162.38 |
SMA (simple moving average) of Morgan Stanley MS
| SMA period | SMA current | SMA prev | SMA prev2 | | 5 day SMA | 172.54 | 171.17 | 169.78 | | 12 day SMA | 167.31 | 165.92 | 164.63 | | 20 day SMA | 166.01 | 165.36 | 164.87 | | 35 day SMA | 164.64 | 164.17 | 163.82 | | 50 day SMA | 162.75 | 162.43 | 162.13 | | 100 day SMA | 154.99 | 154.65 | 154.33 | | 150 day SMA | 146.93 | 146.53 | 146.13 | | 200 day SMA | 139.48 | 139.29 | 139.1 |
|
|
