MartenTransport MRTN full analysis,charts,indicators,moving averages,SMA,DMA,EMA,ADX,MACD,RSIMarten Transport MRTN WideScreen charts, DMA,SMA,EMA technical analysis, forecast prediction, by indicators ADX,MACD,RSI,CCI USA stock exchange
operates under Transportation sector & deals in Trucking Freight Courier Services
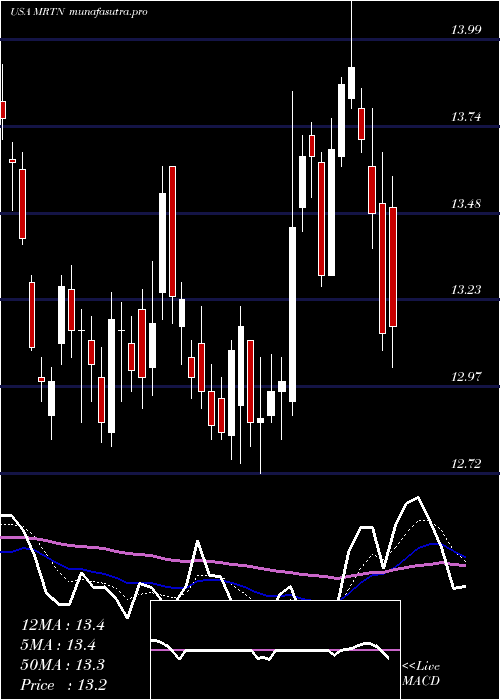
Daily price and charts and targets MartenTransport Strong Daily Stock price targets for MartenTransport MRTN are 11.2 and 11.33 | Daily Target 1 | 11.09 | | Daily Target 2 | 11.17 | | Daily Target 3 | 11.223333333333 | | Daily Target 4 | 11.3 | | Daily Target 5 | 11.35 |
Daily price and volume Marten Transport
| Date |
Closing |
Open |
Range |
Volume |
Fri 05 December 2025 |
11.24 (0.45%) |
11.15 |
11.15 - 11.28 |
0.8263 times |
Thu 04 December 2025 |
11.19 (0.45%) |
11.09 |
11.06 - 11.23 |
1.1205 times |
Wed 03 December 2025 |
11.14 (4.4%) |
10.68 |
10.68 - 11.17 |
1.1369 times |
Tue 02 December 2025 |
10.67 (2.3%) |
10.42 |
10.34 - 10.75 |
1.0784 times |
Mon 01 December 2025 |
10.43 (1.76%) |
10.14 |
10.14 - 10.54 |
0.9334 times |
Fri 28 November 2025 |
10.25 (-0.1%) |
10.25 |
10.16 - 10.31 |
0.3329 times |
Wed 26 November 2025 |
10.26 (1.08%) |
10.08 |
10.07 - 10.33 |
1.3634 times |
Tue 25 November 2025 |
10.15 (3.57%) |
9.91 |
9.85 - 10.20 |
0.9269 times |
Mon 24 November 2025 |
9.80 (-0.41%) |
9.84 |
9.68 - 9.90 |
1.2321 times |
Fri 21 November 2025 |
9.84 (4.46%) |
9.42 |
9.42 - 9.88 |
1.0492 times |
Thu 20 November 2025 |
9.42 (0.11%) |
9.49 |
9.35 - 9.57 |
1.084 times |
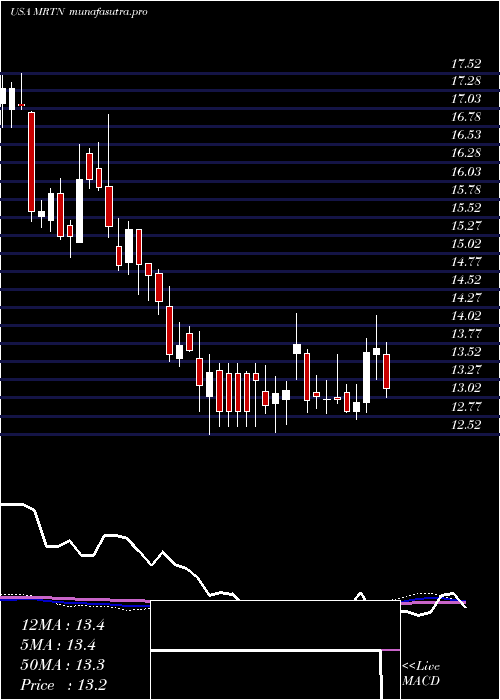
Weekly price and charts MartenTransport Strong weekly Stock price targets for MartenTransport MRTN are 10.69 and 11.83 | Weekly Target 1 | 9.75 | | Weekly Target 2 | 10.49 | | Weekly Target 3 | 10.886666666667 | | Weekly Target 4 | 11.63 | | Weekly Target 5 | 12.03 |
Weekly price and volumes for Marten Transport
| Date |
Closing |
Open |
Range |
Volume |
Fri 05 December 2025 |
11.24 (9.66%) |
10.14 |
10.14 - 11.28 |
1.0731 times |
Fri 28 November 2025 |
10.25 (4.17%) |
9.84 |
9.68 - 10.33 |
0.8119 times |
Fri 21 November 2025 |
9.84 (1.23%) |
9.67 |
9.35 - 9.88 |
1.092 times |
Fri 14 November 2025 |
9.72 (-1.72%) |
9.90 |
9.56 - 10.02 |
0.8526 times |
Fri 07 November 2025 |
9.89 (-3.51%) |
10.08 |
9.69 - 10.18 |
0.7787 times |
Fri 31 October 2025 |
10.25 (0%) |
9.78 |
9.70 - 10.26 |
0.3081 times |
Fri 31 October 2025 |
10.25 (5.45%) |
9.76 |
9.70 - 10.26 |
1.672 times |
Fri 24 October 2025 |
9.72 (-10.08%) |
10.83 |
9.67 - 11.02 |
1.5311 times |
Fri 17 October 2025 |
10.81 (3.15%) |
10.54 |
10.44 - 10.95 |
0.8767 times |
Fri 10 October 2025 |
10.48 (-1.32%) |
10.62 |
10.42 - 11.06 |
1.0038 times |
Fri 03 October 2025 |
10.62 (-1.03%) |
10.74 |
10.35 - 10.83 |
0.9459 times |
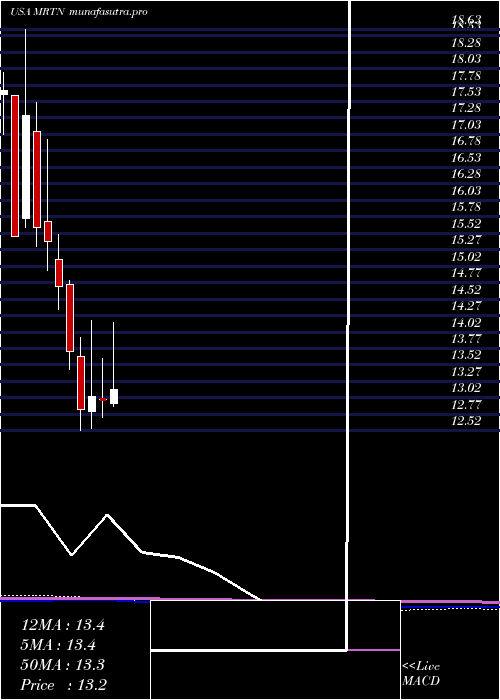
Monthly price and charts MartenTransport Strong monthly Stock price targets for MartenTransport MRTN are 10.69 and 11.83 | Monthly Target 1 | 9.75 | | Monthly Target 2 | 10.49 | | Monthly Target 3 | 10.886666666667 | | Monthly Target 4 | 11.63 | | Monthly Target 5 | 12.03 |
Monthly price and volumes Marten Transport
| Date |
Closing |
Open |
Range |
Volume |
Fri 05 December 2025 |
11.24 (9.66%) |
10.14 |
10.14 - 11.28 |
0.2994 times |
Fri 28 November 2025 |
10.25 (0%) |
10.08 |
9.35 - 10.33 |
0.9862 times |
Fri 31 October 2025 |
10.25 (-3.85%) |
10.58 |
9.67 - 11.06 |
1.6702 times |
Tue 30 September 2025 |
10.66 (-9.97%) |
11.75 |
10.50 - 11.98 |
1.2868 times |
Fri 29 August 2025 |
11.84 (-2.63%) |
12.11 |
11.58 - 12.49 |
1.097 times |
Thu 31 July 2025 |
12.16 (-6.39%) |
12.93 |
12.02 - 14.16 |
1.0989 times |
Mon 30 June 2025 |
12.99 (-0.38%) |
13.00 |
12.72 - 13.62 |
0.7908 times |
Fri 30 May 2025 |
13.04 (1.56%) |
12.81 |
12.56 - 14.19 |
1.0502 times |
Wed 30 April 2025 |
12.84 (-6.41%) |
13.65 |
12.52 - 13.94 |
0.9047 times |
Mon 31 March 2025 |
13.72 (-6.79%) |
14.75 |
13.45 - 14.80 |
0.8158 times |
Fri 28 February 2025 |
14.72 (-4.42%) |
15.12 |
14.37 - 15.50 |
0.6785 times |
DMA SMA EMA moving averages of Marten Transport MRTN
DMA (daily moving average) of Marten Transport MRTN
| DMA period | DMA value | | 5 day DMA | 10.93 | | 12 day DMA | 10.32 | | 20 day DMA | 10.09 | | 35 day DMA | 10.16 | | 50 day DMA | 10.3 | | 100 day DMA | 11.12 | | 150 day DMA | 11.83 | | 200 day DMA | 12.28 | EMA (exponential moving average) of Marten Transport MRTN
| EMA period | EMA current | EMA prev | EMA prev2 | | 5 day EMA | 10.95 | 10.8 | 10.61 | | 12 day EMA | 10.53 | 10.4 | 10.26 | | 20 day EMA | 10.35 | 10.26 | 10.16 | | 35 day EMA | 10.32 | 10.27 | 10.22 | | 50 day EMA | 10.41 | 10.38 | 10.35 |
SMA (simple moving average) of Marten Transport MRTN
| SMA period | SMA current | SMA prev | SMA prev2 | | 5 day SMA | 10.93 | 10.74 | 10.55 | | 12 day SMA | 10.32 | 10.18 | 10.04 | | 20 day SMA | 10.09 | 10.02 | 9.96 | | 35 day SMA | 10.16 | 10.14 | 10.12 | | 50 day SMA | 10.3 | 10.29 | 10.29 | | 100 day SMA | 11.12 | 11.14 | 11.16 | | 150 day SMA | 11.83 | 11.84 | 11.85 | | 200 day SMA | 12.28 | 12.3 | 12.32 |
|
|
