MersanaTherapeutics MRSN full analysis,charts,indicators,moving averages,SMA,DMA,EMA,ADX,MACD,RSIMersana Therapeutics MRSN WideScreen charts, DMA,SMA,EMA technical analysis, forecast prediction, by indicators ADX,MACD,RSI,CCI USA stock exchange
operates under Health Care sector & deals in Major Pharmaceuticals
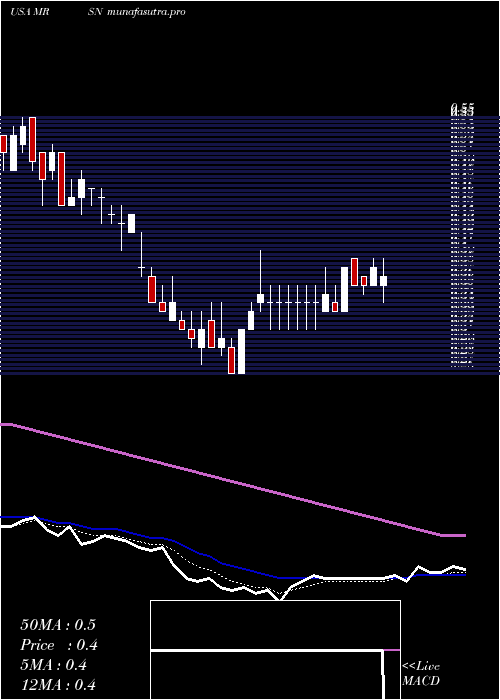
Daily price and charts and targets MersanaTherapeutics Strong Daily Stock price targets for MersanaTherapeutics MRSN are 9.79 and 10.28 | Daily Target 1 | 9.7 | | Daily Target 2 | 9.88 | | Daily Target 3 | 10.193333333333 | | Daily Target 4 | 10.37 | | Daily Target 5 | 10.68 |
Daily price and volume Mersana Therapeutics
| Date |
Closing |
Open |
Range |
Volume |
Tue 21 October 2025 |
10.05 (-3.55%) |
10.27 |
10.02 - 10.51 |
0.1655 times |
Mon 20 October 2025 |
10.42 (5.47%) |
9.92 |
9.92 - 10.42 |
0.4131 times |
Fri 17 October 2025 |
9.88 (-6.26%) |
10.54 |
9.71 - 10.77 |
0.744 times |
Thu 16 October 2025 |
10.54 (0.09%) |
10.53 |
10.39 - 11.09 |
1.06 times |
Wed 15 October 2025 |
10.53 (2.23%) |
10.32 |
9.59 - 11.15 |
1.2319 times |
Tue 14 October 2025 |
10.30 (3.94%) |
9.75 |
9.55 - 10.30 |
0.5081 times |
Mon 13 October 2025 |
9.91 (7.25%) |
9.28 |
9.24 - 10.32 |
1.9641 times |
Fri 10 October 2025 |
9.24 (1.87%) |
9.11 |
8.75 - 9.28 |
0.7526 times |
Thu 09 October 2025 |
9.07 (-3.92%) |
9.50 |
8.63 - 9.50 |
1.203 times |
Wed 08 October 2025 |
9.44 (18.59%) |
8.07 |
7.83 - 9.50 |
1.9577 times |
Tue 07 October 2025 |
7.96 (-4.78%) |
8.23 |
7.85 - 8.23 |
0.4142 times |
Weekly price and charts MersanaTherapeutics Strong weekly Stock price targets for MersanaTherapeutics MRSN are 9.99 and 10.58 | Weekly Target 1 | 9.57 | | Weekly Target 2 | 9.81 | | Weekly Target 3 | 10.16 | | Weekly Target 4 | 10.4 | | Weekly Target 5 | 10.75 |
Weekly price and volumes for Mersana Therapeutics
| Date |
Closing |
Open |
Range |
Volume |
Tue 21 October 2025 |
10.05 (1.72%) |
9.92 |
9.92 - 10.51 |
0.2227 times |
Fri 17 October 2025 |
9.88 (6.93%) |
9.28 |
9.24 - 11.15 |
2.1199 times |
Fri 10 October 2025 |
9.24 (11.59%) |
8.50 |
7.83 - 9.50 |
1.7615 times |
Fri 03 October 2025 |
8.28 (9.38%) |
7.54 |
7.37 - 8.28 |
0.8936 times |
Fri 26 September 2025 |
7.57 (4.41%) |
7.17 |
6.87 - 7.57 |
0.8685 times |
Fri 19 September 2025 |
7.25 (1.54%) |
7.34 |
7.04 - 7.49 |
0.9318 times |
Fri 12 September 2025 |
7.14 (4.69%) |
6.83 |
6.63 - 7.70 |
0.9605 times |
Fri 05 September 2025 |
6.82 (-6.83%) |
7.33 |
6.79 - 7.55 |
0.9704 times |
Fri 29 August 2025 |
7.32 (0%) |
7.78 |
7.32 - 7.85 |
0.1668 times |
Fri 29 August 2025 |
7.32 (-5.55%) |
7.73 |
7.32 - 8.09 |
1.1043 times |
Fri 22 August 2025 |
7.75 (8.24%) |
7.07 |
6.96 - 8.19 |
2.4424 times |
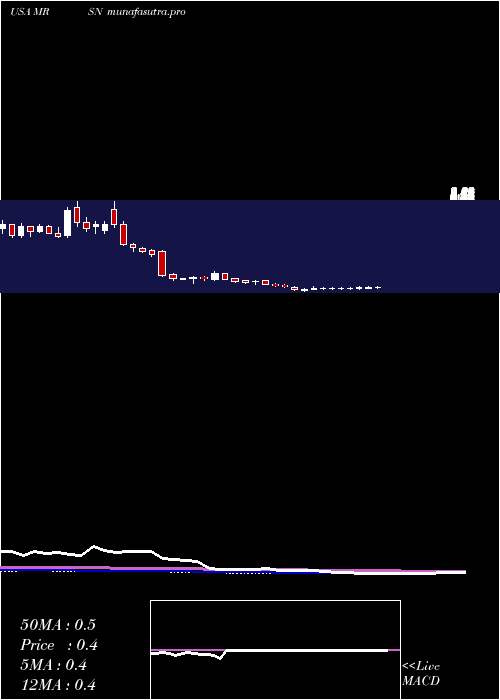
Monthly price and charts MersanaTherapeutics Strong monthly Stock price targets for MersanaTherapeutics MRSN are 8.84 and 12.36 | Monthly Target 1 | 6.09 | | Monthly Target 2 | 8.07 | | Monthly Target 3 | 9.61 | | Monthly Target 4 | 11.59 | | Monthly Target 5 | 13.13 |
Monthly price and volumes Mersana Therapeutics
| Date |
Closing |
Open |
Range |
Volume |
Tue 21 October 2025 |
10.05 (29.51%) |
7.71 |
7.63 - 11.15 |
0.0195 times |
Tue 30 September 2025 |
7.76 (6.01%) |
7.33 |
6.63 - 8.22 |
0.0173 times |
Fri 29 August 2025 |
7.32 (6.86%) |
6.66 |
5.21 - 8.19 |
0.0354 times |
Thu 31 July 2025 |
6.85 (2183.33%) |
0.30 |
0.27 - 7.60 |
0.9721 times |
Mon 30 June 2025 |
0.30 (-11.76%) |
0.34 |
0.28 - 0.46 |
0.9572 times |
Fri 30 May 2025 |
0.34 (-20.93%) |
0.43 |
0.30 - 0.43 |
1.0814 times |
Wed 30 April 2025 |
0.43 (26.47%) |
0.34 |
0.26 - 0.44 |
0.8724 times |
Mon 31 March 2025 |
0.34 (-34.62%) |
0.53 |
0.34 - 0.55 |
0.9822 times |
Fri 28 February 2025 |
0.52 (-14.75%) |
0.59 |
0.48 - 0.82 |
1.5692 times |
Fri 31 January 2025 |
0.61 (-57.34%) |
1.44 |
0.49 - 1.51 |
3.4932 times |
Tue 31 December 2024 |
1.43 (-34.1%) |
2.60 |
1.35 - 2.83 |
0.405 times |

DMA SMA EMA moving averages of Mersana Therapeutics MRSN
DMA (daily moving average) of Mersana Therapeutics MRSN
| DMA period | DMA value | | 5 day DMA | 10.28 | | 12 day DMA | 9.64 | | 20 day DMA | 8.87 | | 35 day DMA | 8.17 | | 50 day DMA | 7.95 | | 100 day DMA | 4.83 | | 150 day DMA | 3.34 | | 200 day DMA | 2.66 | EMA (exponential moving average) of Mersana Therapeutics MRSN
| EMA period | EMA current | EMA prev | EMA prev2 | | 5 day EMA | 10.12 | 10.16 | 10.03 | | 12 day EMA | 9.65 | 9.58 | 9.43 | | 20 day EMA | 9.15 | 9.06 | 8.92 | | 35 day EMA | 8.57 | 8.48 | 8.37 | | 50 day EMA | 8.04 | 7.96 | 7.86 |
SMA (simple moving average) of Mersana Therapeutics MRSN
| SMA period | SMA current | SMA prev | SMA prev2 | | 5 day SMA | 10.28 | 10.33 | 10.23 | | 12 day SMA | 9.64 | 9.49 | 9.29 | | 20 day SMA | 8.87 | 8.74 | 8.59 | | 35 day SMA | 8.17 | 8.08 | 7.99 | | 50 day SMA | 7.95 | 7.87 | 7.78 | | 100 day SMA | 4.83 | 4.74 | 4.64 | | 150 day SMA | 3.34 | 3.28 | 3.21 | | 200 day SMA | 2.66 | 2.62 | 2.57 |
|
|
