ModernaInc MRNA full analysis,charts,indicators,moving averages,SMA,DMA,EMA,ADX,MACD,RSIModerna Inc MRNA WideScreen charts, DMA,SMA,EMA technical analysis, forecast prediction, by indicators ADX,MACD,RSI,CCI USA stock exchange
operates under Health Care sector & deals in Biotechnology Biological Products No Diagnostic Substances
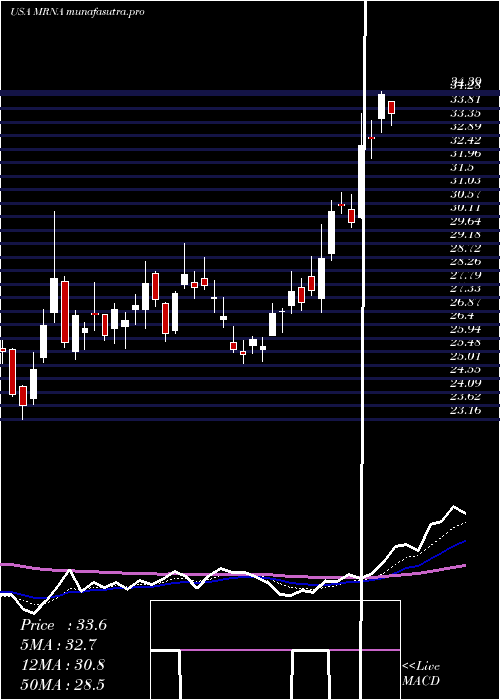
Daily price and charts and targets ModernaInc Strong Daily Stock price targets for ModernaInc MRNA are 25.1 and 26.3 | Daily Target 1 | 24.16 | | Daily Target 2 | 24.83 | | Daily Target 3 | 25.363333333333 | | Daily Target 4 | 26.03 | | Daily Target 5 | 26.56 |
Daily price and volume Moderna Inc
| Date |
Closing |
Open |
Range |
Volume |
Thu 04 December 2025 |
25.49 (1.23%) |
25.14 |
24.70 - 25.90 |
0.6885 times |
Wed 03 December 2025 |
25.18 (4.66%) |
24.04 |
23.93 - 25.20 |
0.9485 times |
Tue 02 December 2025 |
24.06 (-0.41%) |
24.30 |
23.92 - 24.63 |
0.8991 times |
Mon 01 December 2025 |
24.16 (-7.01%) |
25.05 |
24.13 - 25.25 |
1.1704 times |
Fri 28 November 2025 |
25.98 (3.88%) |
25.01 |
24.87 - 26.05 |
0.5226 times |
Wed 26 November 2025 |
25.01 (1.01%) |
24.70 |
24.38 - 25.32 |
0.5636 times |
Tue 25 November 2025 |
24.76 (2.53%) |
24.01 |
23.97 - 24.80 |
0.5463 times |
Mon 24 November 2025 |
24.15 (1.81%) |
23.91 |
23.55 - 24.34 |
0.6966 times |
Fri 21 November 2025 |
23.72 (6.08%) |
22.39 |
22.28 - 23.94 |
1.6942 times |
Thu 20 November 2025 |
22.36 (-7.53%) |
24.45 |
22.32 - 24.91 |
2.2703 times |
Wed 19 November 2025 |
24.18 (-2.97%) |
24.95 |
23.77 - 25.06 |
1.1461 times |
Weekly price and charts ModernaInc Strong weekly Stock price targets for ModernaInc MRNA are 24.71 and 26.69 | Weekly Target 1 | 23.12 | | Weekly Target 2 | 24.31 | | Weekly Target 3 | 25.103333333333 | | Weekly Target 4 | 26.29 | | Weekly Target 5 | 27.08 |
Weekly price and volumes for Moderna Inc
| Date |
Closing |
Open |
Range |
Volume |
Thu 04 December 2025 |
25.49 (-1.89%) |
25.05 |
23.92 - 25.90 |
0.7508 times |
Fri 28 November 2025 |
25.98 (9.53%) |
23.91 |
23.55 - 26.05 |
0.4718 times |
Fri 21 November 2025 |
23.72 (-4.24%) |
24.50 |
22.28 - 25.33 |
1.3832 times |
Fri 14 November 2025 |
24.77 (0.86%) |
24.75 |
23.74 - 27.10 |
1.0644 times |
Fri 07 November 2025 |
24.56 (-9.57%) |
24.73 |
23.04 - 25.56 |
1.0474 times |
Fri 31 October 2025 |
27.16 (0%) |
27.83 |
26.87 - 27.87 |
0.3877 times |
Fri 31 October 2025 |
27.16 (1.61%) |
27.01 |
24.25 - 29.20 |
2.1899 times |
Fri 24 October 2025 |
26.73 (2.1%) |
26.47 |
25.52 - 28.12 |
0.7031 times |
Fri 17 October 2025 |
26.18 (-2.42%) |
27.24 |
25.69 - 28.48 |
0.9618 times |
Fri 10 October 2025 |
26.83 (-5.86%) |
28.50 |
26.24 - 29.45 |
1.0399 times |
Fri 03 October 2025 |
28.50 (16.37%) |
24.82 |
24.44 - 28.99 |
1.2281 times |
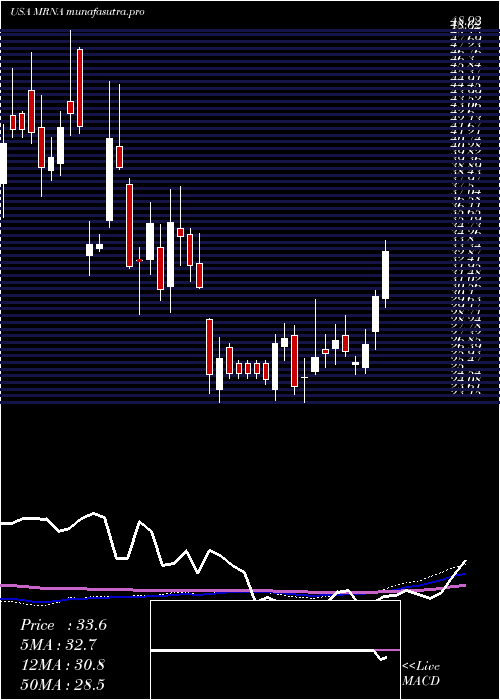
Monthly price and charts ModernaInc Strong monthly Stock price targets for ModernaInc MRNA are 24.71 and 26.69 | Monthly Target 1 | 23.12 | | Monthly Target 2 | 24.31 | | Monthly Target 3 | 25.103333333333 | | Monthly Target 4 | 26.29 | | Monthly Target 5 | 27.08 |
Monthly price and volumes Moderna Inc
| Date |
Closing |
Open |
Range |
Volume |
Thu 04 December 2025 |
25.49 (-1.89%) |
25.05 |
23.92 - 25.90 |
0.1573 times |
Fri 28 November 2025 |
25.98 (-4.34%) |
24.73 |
22.28 - 27.10 |
0.831 times |
Fri 31 October 2025 |
27.16 (5.15%) |
26.12 |
24.25 - 29.45 |
1.2727 times |
Tue 30 September 2025 |
25.83 (7.22%) |
23.93 |
23.18 - 27.10 |
1.3477 times |
Fri 29 August 2025 |
24.09 (-18.5%) |
27.57 |
23.84 - 28.59 |
1.0201 times |
Thu 31 July 2025 |
29.56 (7.14%) |
27.31 |
26.81 - 35.59 |
1.0276 times |
Mon 30 June 2025 |
27.59 (3.88%) |
26.92 |
25.06 - 29.19 |
0.9097 times |
Fri 30 May 2025 |
26.56 (-6.94%) |
27.68 |
23.16 - 30.30 |
1.5462 times |
Wed 30 April 2025 |
28.54 (0.67%) |
28.70 |
23.15 - 28.85 |
0.9336 times |
Mon 31 March 2025 |
28.35 (-8.43%) |
31.18 |
26.80 - 38.12 |
0.9542 times |
Fri 28 February 2025 |
30.96 (-21.46%) |
38.21 |
29.25 - 38.65 |
1.2486 times |
DMA SMA EMA moving averages of Moderna Inc MRNA
DMA (daily moving average) of Moderna Inc MRNA
| DMA period | DMA value | | 5 day DMA | 24.97 | | 12 day DMA | 24.5 | | 20 day DMA | 24.76 | | 35 day DMA | 25.41 | | 50 day DMA | 25.84 | | 100 day DMA | 26.56 | | 150 day DMA | 26.85 | | 200 day DMA | 27.61 | EMA (exponential moving average) of Moderna Inc MRNA
| EMA period | EMA current | EMA prev | EMA prev2 | | 5 day EMA | 24.98 | 24.72 | 24.49 | | 12 day EMA | 24.82 | 24.7 | 24.61 | | 20 day EMA | 24.93 | 24.87 | 24.84 | | 35 day EMA | 25.27 | 25.26 | 25.26 | | 50 day EMA | 25.75 | 25.76 | 25.78 |
SMA (simple moving average) of Moderna Inc MRNA
| SMA period | SMA current | SMA prev | SMA prev2 | | 5 day SMA | 24.97 | 24.88 | 24.79 | | 12 day SMA | 24.5 | 24.44 | 24.4 | | 20 day SMA | 24.76 | 24.66 | 24.59 | | 35 day SMA | 25.41 | 25.48 | 25.51 | | 50 day SMA | 25.84 | 25.85 | 25.86 | | 100 day SMA | 26.56 | 26.62 | 26.7 | | 150 day SMA | 26.85 | 26.87 | 26.89 | | 200 day SMA | 27.61 | 27.66 | 27.7 |
|
|
