BlackrockMuniyield MQT full analysis,charts,indicators,moving averages,SMA,DMA,EMA,ADX,MACD,RSIBlackrock Muniyield MQT WideScreen charts, DMA,SMA,EMA technical analysis, forecast prediction, by indicators ADX,MACD,RSI,CCI USA stock exchange
operates under N A sector & deals in N A
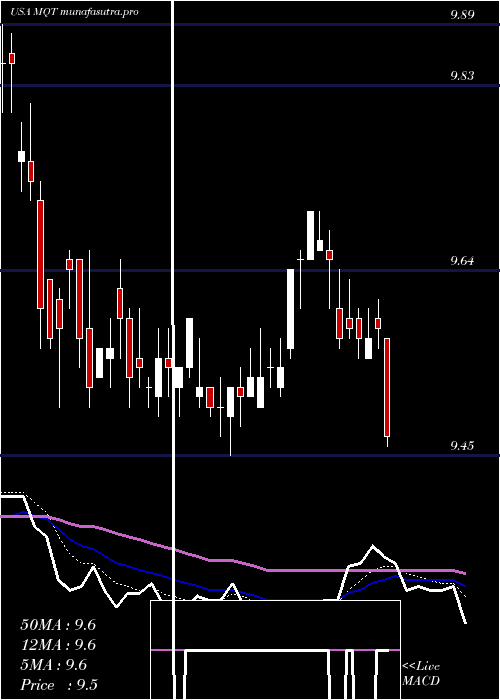
Daily price and charts and targets BlackrockMuniyield Strong Daily Stock price targets for BlackrockMuniyield MQT are 10.05 and 10.14 | Daily Target 1 | 10.03 | | Daily Target 2 | 10.06 | | Daily Target 3 | 10.116666666667 | | Daily Target 4 | 10.15 | | Daily Target 5 | 10.21 |
Daily price and volume Blackrock Muniyield
| Date |
Closing |
Open |
Range |
Volume |
Tue 21 October 2025 |
10.10 (0.3%) |
10.17 |
10.08 - 10.17 |
1.3249 times |
Mon 20 October 2025 |
10.07 (0%) |
10.09 |
10.05 - 10.15 |
0.9602 times |
Fri 17 October 2025 |
10.07 (-0.49%) |
10.08 |
10.04 - 10.14 |
1.0797 times |
Thu 16 October 2025 |
10.12 (-0.59%) |
10.18 |
10.10 - 10.18 |
2.6817 times |
Wed 15 October 2025 |
10.18 (-0.2%) |
10.14 |
10.14 - 10.22 |
0.4315 times |
Tue 14 October 2025 |
10.20 (0%) |
10.15 |
10.15 - 10.25 |
1.2548 times |
Mon 13 October 2025 |
10.20 (1.49%) |
10.15 |
10.10 - 10.25 |
0.4666 times |
Tue 07 October 2025 |
10.05 (0.1%) |
10.04 |
10.04 - 10.08 |
0.8137 times |
Mon 06 October 2025 |
10.04 (0%) |
10.03 |
10.03 - 10.06 |
0.5155 times |
Fri 03 October 2025 |
10.04 (-0.59%) |
10.07 |
10.04 - 10.10 |
0.4714 times |
Thu 02 October 2025 |
10.10 (0%) |
10.14 |
10.06 - 10.17 |
0.9008 times |
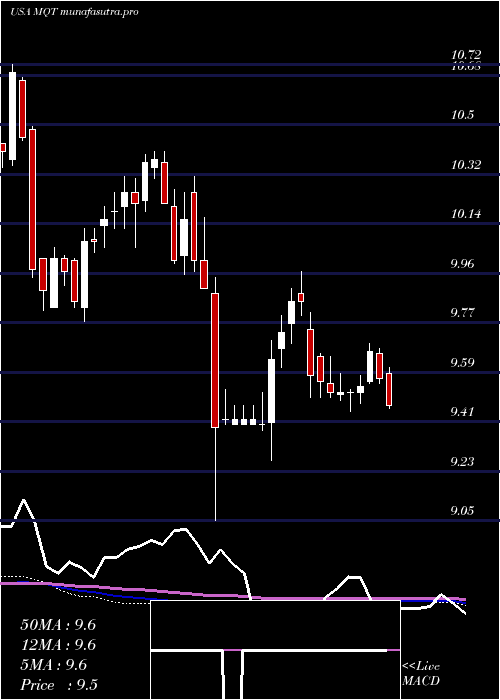
Weekly price and charts BlackrockMuniyield Strong weekly Stock price targets for BlackrockMuniyield MQT are 10.08 and 10.2 | Weekly Target 1 | 9.99 | | Weekly Target 2 | 10.04 | | Weekly Target 3 | 10.106666666667 | | Weekly Target 4 | 10.16 | | Weekly Target 5 | 10.23 |
Weekly price and volumes for Blackrock Muniyield
| Date |
Closing |
Open |
Range |
Volume |
Tue 21 October 2025 |
10.10 (0.3%) |
10.09 |
10.05 - 10.17 |
0.5524 times |
Fri 17 October 2025 |
10.07 (0.2%) |
10.15 |
10.04 - 10.25 |
1.4296 times |
Tue 07 October 2025 |
10.05 (0.1%) |
10.03 |
10.03 - 10.08 |
0.3213 times |
Fri 03 October 2025 |
10.04 (0.3%) |
10.02 |
10.02 - 10.17 |
0.8321 times |
Fri 26 September 2025 |
10.01 (-1.09%) |
10.11 |
9.95 - 10.15 |
1.2999 times |
Fri 19 September 2025 |
10.12 (-0.2%) |
10.10 |
10.09 - 10.18 |
0.8195 times |
Fri 12 September 2025 |
10.14 (4.21%) |
9.77 |
9.76 - 10.15 |
1.3303 times |
Fri 05 September 2025 |
9.73 (1.46%) |
9.52 |
9.52 - 9.74 |
1.2437 times |
Fri 29 August 2025 |
9.59 (0%) |
9.52 |
9.51 - 9.59 |
0.117 times |
Fri 29 August 2025 |
9.59 (0.95%) |
9.49 |
9.47 - 9.59 |
2.0543 times |
Fri 22 August 2025 |
9.50 (-0.84%) |
9.59 |
9.39 - 9.61 |
0.9442 times |
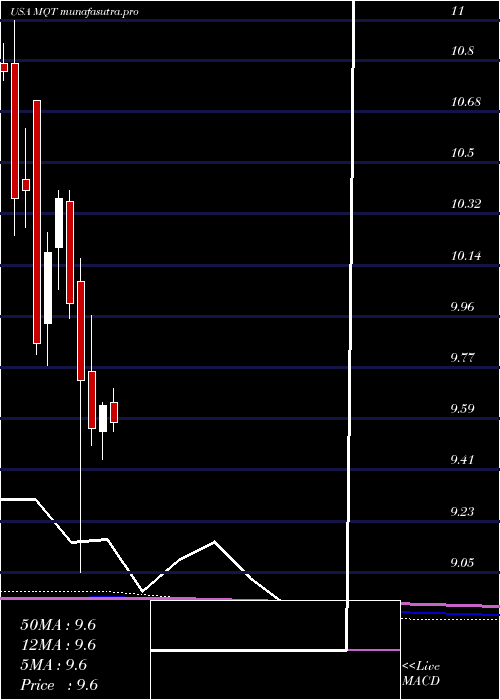
Monthly price and charts BlackrockMuniyield Strong monthly Stock price targets for BlackrockMuniyield MQT are 10.07 and 10.29 | Monthly Target 1 | 9.91 | | Monthly Target 2 | 10 | | Monthly Target 3 | 10.126666666667 | | Monthly Target 4 | 10.22 | | Monthly Target 5 | 10.35 |
Monthly price and volumes Blackrock Muniyield
| Date |
Closing |
Open |
Range |
Volume |
Tue 21 October 2025 |
10.10 (0.7%) |
10.06 |
10.03 - 10.25 |
0.6404 times |
Tue 30 September 2025 |
10.03 (4.59%) |
9.52 |
9.52 - 10.18 |
1.1213 times |
Fri 29 August 2025 |
9.59 (1.59%) |
9.45 |
9.39 - 9.65 |
1.1902 times |
Thu 31 July 2025 |
9.44 (-2.07%) |
9.65 |
9.32 - 9.81 |
0.7572 times |
Mon 30 June 2025 |
9.64 (0.84%) |
9.55 |
9.45 - 9.65 |
0.8839 times |
Fri 30 May 2025 |
9.56 (-1.75%) |
9.76 |
9.50 - 9.96 |
0.6641 times |
Wed 30 April 2025 |
9.73 (-2.7%) |
10.08 |
9.05 - 10.16 |
1.6299 times |
Mon 31 March 2025 |
10.00 (-3.57%) |
10.36 |
9.95 - 10.40 |
0.788 times |
Fri 28 February 2025 |
10.37 (1.87%) |
10.20 |
10.05 - 10.40 |
0.8963 times |
Fri 31 January 2025 |
10.18 (3.25%) |
9.93 |
9.78 - 10.25 |
1.4287 times |
Tue 31 December 2024 |
9.86 (-5.19%) |
10.72 |
9.82 - 10.72 |
1.2908 times |
DMA SMA EMA moving averages of Blackrock Muniyield MQT
DMA (daily moving average) of Blackrock Muniyield MQT
| DMA period | DMA value | | 5 day DMA | 10.11 | | 12 day DMA | 10.11 | | 20 day DMA | 10.1 | | 35 day DMA | 10.01 | | 50 day DMA | 9.87 | | 100 day DMA | 9.69 | | 150 day DMA | 9.71 | | 200 day DMA | 9.82 | EMA (exponential moving average) of Blackrock Muniyield MQT
| EMA period | EMA current | EMA prev | EMA prev2 | | 5 day EMA | 10.1 | 10.1 | 10.12 | | 12 day EMA | 10.1 | 10.1 | 10.11 | | 20 day EMA | 10.07 | 10.07 | 10.07 | | 35 day EMA | 9.97 | 9.96 | 9.95 | | 50 day EMA | 9.86 | 9.85 | 9.84 |
SMA (simple moving average) of Blackrock Muniyield MQT
| SMA period | SMA current | SMA prev | SMA prev2 | | 5 day SMA | 10.11 | 10.13 | 10.15 | | 12 day SMA | 10.11 | 10.1 | 10.1 | | 20 day SMA | 10.1 | 10.1 | 10.1 | | 35 day SMA | 10.01 | 9.99 | 9.97 | | 50 day SMA | 9.87 | 9.86 | 9.85 | | 100 day SMA | 9.69 | 9.69 | 9.68 | | 150 day SMA | 9.71 | 9.71 | 9.71 | | 200 day SMA | 9.82 | 9.82 | 9.82 |
|
|
