MorningstarInc MORN full analysis,charts,indicators,moving averages,SMA,DMA,EMA,ADX,MACD,RSIMorningstar Inc MORN WideScreen charts, DMA,SMA,EMA technical analysis, forecast prediction, by indicators ADX,MACD,RSI,CCI USA stock exchange
operates under Finance sector & deals in Investment Managers
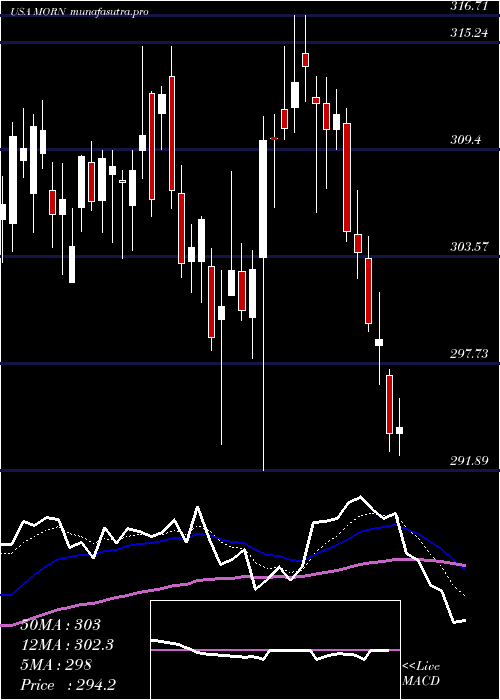
Daily price and charts and targets MorningstarInc Strong Daily Stock price targets for MorningstarInc MORN are 212.36 and 218.1 | Daily Target 1 | 210.83 | | Daily Target 2 | 213.89 | | Daily Target 3 | 216.57333333333 | | Daily Target 4 | 219.63 | | Daily Target 5 | 222.31 |
Daily price and volume Morningstar Inc
| Date |
Closing |
Open |
Range |
Volume |
Thu 04 December 2025 |
216.94 (-0.43%) |
217.68 |
213.52 - 219.26 |
1.04 times |
Wed 03 December 2025 |
217.87 (0.33%) |
217.48 |
214.69 - 219.42 |
1.2376 times |
Tue 02 December 2025 |
217.15 (0.36%) |
217.25 |
215.52 - 219.62 |
1.107 times |
Mon 01 December 2025 |
216.38 (0.71%) |
214.03 |
213.50 - 217.45 |
1.0308 times |
Fri 28 November 2025 |
214.86 (0.53%) |
213.01 |
212.65 - 217.83 |
0.6306 times |
Wed 26 November 2025 |
213.72 (0.08%) |
212.48 |
212.48 - 215.76 |
0.7797 times |
Tue 25 November 2025 |
213.55 (1.6%) |
212.37 |
211.00 - 214.63 |
0.7826 times |
Mon 24 November 2025 |
210.18 (-1.25%) |
211.06 |
209.37 - 212.18 |
1.1536 times |
Fri 21 November 2025 |
212.84 (1.73%) |
210.67 |
208.95 - 215.23 |
1.1426 times |
Thu 20 November 2025 |
209.22 (-0.48%) |
210.57 |
208.05 - 212.62 |
1.0956 times |
Wed 19 November 2025 |
210.22 (0.18%) |
209.62 |
207.95 - 211.83 |
0.9798 times |
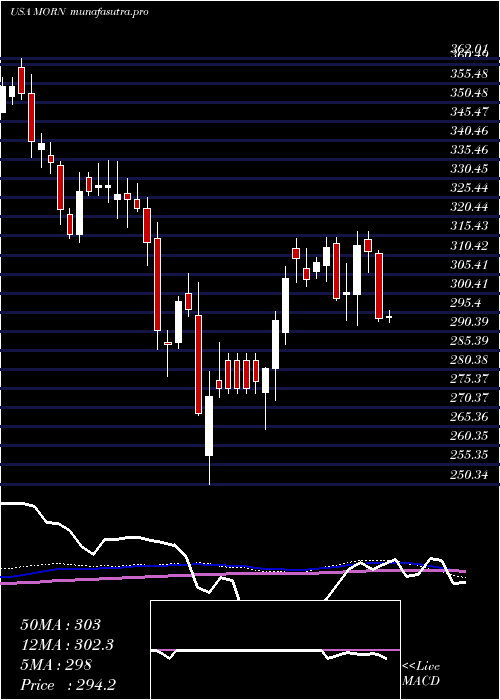
Weekly price and charts MorningstarInc Strong weekly Stock price targets for MorningstarInc MORN are 215.22 and 221.34 | Weekly Target 1 | 210.57 | | Weekly Target 2 | 213.75 | | Weekly Target 3 | 216.68666666667 | | Weekly Target 4 | 219.87 | | Weekly Target 5 | 222.81 |
Weekly price and volumes for Morningstar Inc
| Date |
Closing |
Open |
Range |
Volume |
Thu 04 December 2025 |
216.94 (0.97%) |
214.03 |
213.50 - 219.62 |
0.8213 times |
Fri 28 November 2025 |
214.86 (0.95%) |
211.06 |
209.37 - 217.83 |
0.6225 times |
Fri 21 November 2025 |
212.84 (0.42%) |
212.05 |
205.97 - 215.23 |
0.9955 times |
Fri 14 November 2025 |
211.95 (-1.64%) |
215.65 |
211.76 - 217.21 |
0.9363 times |
Fri 07 November 2025 |
215.49 (1.5%) |
213.69 |
206.68 - 215.75 |
1.6777 times |
Fri 31 October 2025 |
212.30 (0%) |
213.41 |
211.61 - 218.13 |
0.2787 times |
Fri 31 October 2025 |
212.30 (-3.3%) |
219.54 |
202.89 - 222.00 |
1.6823 times |
Fri 24 October 2025 |
219.54 (2.34%) |
215.15 |
214.34 - 223.79 |
0.8728 times |
Fri 17 October 2025 |
214.51 (-4.81%) |
225.94 |
210.02 - 227.51 |
0.9743 times |
Fri 10 October 2025 |
225.34 (-0.34%) |
226.29 |
221.02 - 228.95 |
1.1385 times |
Fri 03 October 2025 |
226.12 (-3.74%) |
234.10 |
222.71 - 235.37 |
1.6169 times |
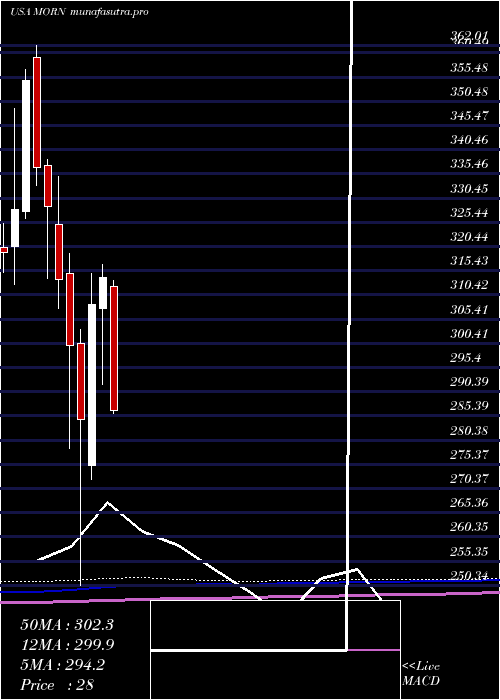
Monthly price and charts MorningstarInc Strong monthly Stock price targets for MorningstarInc MORN are 215.22 and 221.34 | Monthly Target 1 | 210.57 | | Monthly Target 2 | 213.75 | | Monthly Target 3 | 216.68666666667 | | Monthly Target 4 | 219.87 | | Monthly Target 5 | 222.81 |
Monthly price and volumes Morningstar Inc
| Date |
Closing |
Open |
Range |
Volume |
Thu 04 December 2025 |
216.94 (0.97%) |
214.03 |
213.50 - 219.62 |
0.2129 times |
Fri 28 November 2025 |
214.86 (1.21%) |
213.69 |
205.97 - 217.83 |
1.097 times |
Fri 31 October 2025 |
212.30 (-8.5%) |
232.03 |
202.89 - 233.46 |
1.5168 times |
Tue 30 September 2025 |
232.01 (-11.59%) |
261.76 |
230.09 - 261.76 |
1.7175 times |
Fri 29 August 2025 |
262.42 (-5.08%) |
274.43 |
253.55 - 276.47 |
1.2657 times |
Thu 31 July 2025 |
276.46 (-11.94%) |
312.24 |
269.76 - 313.40 |
1.2204 times |
Mon 30 June 2025 |
313.93 (1.79%) |
307.70 |
291.89 - 316.71 |
0.861 times |
Fri 30 May 2025 |
308.42 (8.32%) |
275.21 |
272.14 - 314.90 |
0.7048 times |
Wed 30 April 2025 |
284.72 (-5.05%) |
300.37 |
250.34 - 303.32 |
0.6813 times |
Mon 31 March 2025 |
299.87 (-4.41%) |
314.85 |
278.64 - 318.95 |
0.7227 times |
Fri 28 February 2025 |
313.72 (-4.54%) |
325.03 |
307.58 - 335.00 |
0.4365 times |
DMA SMA EMA moving averages of Morningstar Inc MORN
DMA (daily moving average) of Morningstar Inc MORN
| DMA period | DMA value | | 5 day DMA | 216.64 | | 12 day DMA | 213.57 | | 20 day DMA | 213.46 | | 35 day DMA | 214.29 | | 50 day DMA | 218.27 | | 100 day DMA | 240.16 | | 150 day DMA | 261.64 | | 200 day DMA | 268.86 | EMA (exponential moving average) of Morningstar Inc MORN
| EMA period | EMA current | EMA prev | EMA prev2 | | 5 day EMA | 216.39 | 216.11 | 215.23 | | 12 day EMA | 214.86 | 214.48 | 213.86 | | 20 day EMA | 214.71 | 214.48 | 214.12 | | 35 day EMA | 216.91 | 216.91 | 216.85 | | 50 day EMA | 219.5 | 219.6 | 219.67 |
SMA (simple moving average) of Morningstar Inc MORN
| SMA period | SMA current | SMA prev | SMA prev2 | | 5 day SMA | 216.64 | 216 | 215.13 | | 12 day SMA | 213.57 | 212.77 | 212.28 | | 20 day SMA | 213.46 | 213.24 | 212.93 | | 35 day SMA | 214.29 | 214.37 | 214.58 | | 50 day SMA | 218.27 | 218.67 | 219.03 | | 100 day SMA | 240.16 | 240.86 | 241.62 | | 150 day SMA | 261.64 | 262.09 | 262.52 | | 200 day SMA | 268.86 | 269.42 | 269.95 |
|
|
