MolinaHealthcare MOH full analysis,charts,indicators,moving averages,SMA,DMA,EMA,ADX,MACD,RSIMolina Healthcare MOH WideScreen charts, DMA,SMA,EMA technical analysis, forecast prediction, by indicators ADX,MACD,RSI,CCI USA stock exchange
operates under Health Care sector & deals in Medical Specialities
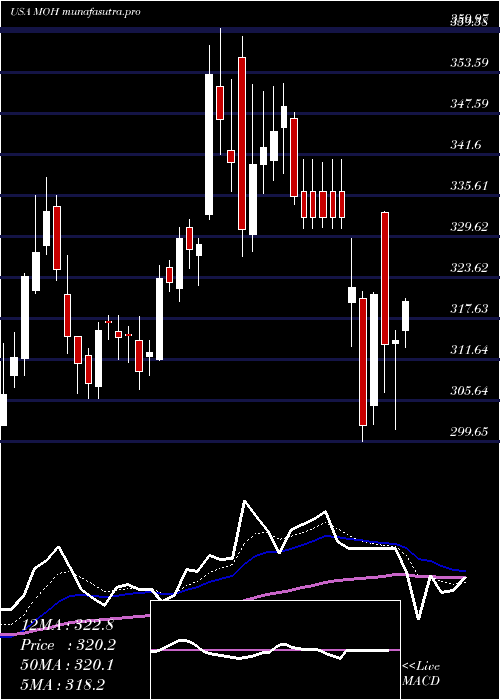
Daily price and charts and targets MolinaHealthcare Strong Daily Stock price targets for MolinaHealthcare MOH are 149.49 and 151.77 | Daily Target 1 | 147.61 | | Daily Target 2 | 149.09 | | Daily Target 3 | 149.89 | | Daily Target 4 | 151.37 | | Daily Target 5 | 152.17 |
Daily price and volume Molina Healthcare
| Date |
Closing |
Open |
Range |
Volume |
Thu 04 December 2025 |
150.57 (0.99%) |
148.50 |
148.41 - 150.69 |
0.7602 times |
Wed 03 December 2025 |
149.09 (2.14%) |
146.38 |
145.76 - 151.00 |
0.8048 times |
Tue 02 December 2025 |
145.97 (0.67%) |
144.50 |
142.28 - 146.25 |
1.2885 times |
Mon 01 December 2025 |
145.00 (-2.2%) |
148.22 |
144.94 - 148.60 |
1.1449 times |
Fri 28 November 2025 |
148.26 (-0.05%) |
149.01 |
147.55 - 149.49 |
0.3807 times |
Wed 26 November 2025 |
148.34 (1.07%) |
148.10 |
144.76 - 148.67 |
0.4179 times |
Tue 25 November 2025 |
146.77 (0.98%) |
145.41 |
145.40 - 151.00 |
1.1242 times |
Mon 24 November 2025 |
145.35 (2.68%) |
143.08 |
141.48 - 152.76 |
1.2232 times |
Fri 21 November 2025 |
141.56 (5.24%) |
134.99 |
133.65 - 143.72 |
1.6207 times |
Thu 20 November 2025 |
134.51 (-2.61%) |
138.40 |
133.40 - 138.84 |
1.2349 times |
Wed 19 November 2025 |
138.12 (-2.24%) |
142.12 |
137.04 - 142.46 |
1.5078 times |
Weekly price and charts MolinaHealthcare Strong weekly Stock price targets for MolinaHealthcare MOH are 146.43 and 155.15 | Weekly Target 1 | 139.23 | | Weekly Target 2 | 144.9 | | Weekly Target 3 | 147.95 | | Weekly Target 4 | 153.62 | | Weekly Target 5 | 156.67 |
Weekly price and volumes for Molina Healthcare
| Date |
Closing |
Open |
Range |
Volume |
Thu 04 December 2025 |
150.57 (1.56%) |
148.22 |
142.28 - 151.00 |
0.9254 times |
Fri 28 November 2025 |
148.26 (4.73%) |
143.08 |
141.48 - 152.76 |
0.7281 times |
Fri 21 November 2025 |
141.56 (2.92%) |
137.51 |
133.40 - 143.72 |
1.5362 times |
Fri 14 November 2025 |
137.54 (-9.55%) |
145.00 |
136.48 - 147.14 |
1.2928 times |
Fri 07 November 2025 |
152.06 (-0.65%) |
146.82 |
145.03 - 152.95 |
0.757 times |
Fri 31 October 2025 |
153.06 (0%) |
151.10 |
147.75 - 153.57 |
0.2518 times |
Fri 31 October 2025 |
153.06 (-6.26%) |
163.87 |
147.75 - 165.00 |
1.4335 times |
Fri 24 October 2025 |
163.29 (-15.25%) |
193.10 |
152.25 - 199.22 |
1.781 times |
Fri 17 October 2025 |
192.68 (-0.71%) |
193.66 |
186.00 - 196.54 |
0.733 times |
Fri 10 October 2025 |
194.05 (-3.92%) |
202.70 |
193.27 - 206.89 |
0.5613 times |
Fri 03 October 2025 |
201.97 (5.2%) |
192.00 |
189.45 - 203.27 |
0.5888 times |
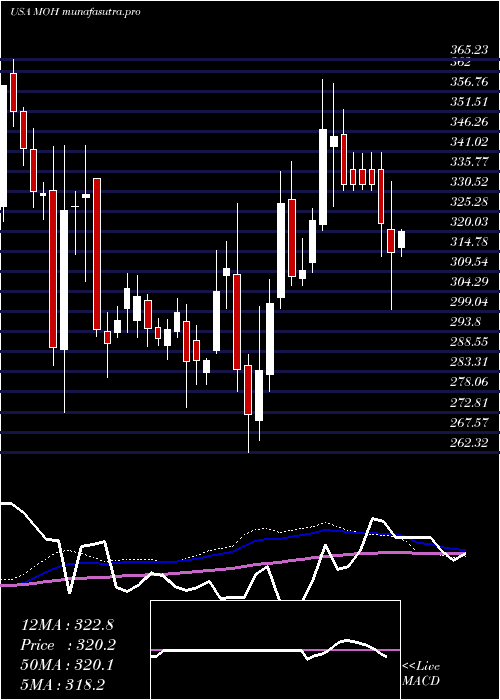
Monthly price and charts MolinaHealthcare Strong monthly Stock price targets for MolinaHealthcare MOH are 146.43 and 155.15 | Monthly Target 1 | 139.23 | | Monthly Target 2 | 144.9 | | Monthly Target 3 | 147.95 | | Monthly Target 4 | 153.62 | | Monthly Target 5 | 156.67 |
Monthly price and volumes Molina Healthcare
| Date |
Closing |
Open |
Range |
Volume |
Thu 04 December 2025 |
150.57 (1.56%) |
148.22 |
142.28 - 151.00 |
0.2543 times |
Fri 28 November 2025 |
148.26 (-3.14%) |
146.82 |
133.40 - 152.95 |
1.1857 times |
Fri 31 October 2025 |
153.06 (-20.01%) |
192.38 |
147.75 - 206.89 |
1.4026 times |
Tue 30 September 2025 |
191.36 (5.82%) |
181.31 |
166.46 - 197.79 |
1.1565 times |
Fri 29 August 2025 |
180.83 (14.54%) |
159.31 |
151.95 - 181.11 |
1.4164 times |
Thu 31 July 2025 |
157.87 (-47.01%) |
296.54 |
155.53 - 311.52 |
2.1078 times |
Mon 30 June 2025 |
297.90 (-2.34%) |
301.98 |
287.02 - 303.98 |
0.4887 times |
Fri 30 May 2025 |
305.04 (-6.72%) |
324.56 |
291.20 - 333.00 |
0.5537 times |
Wed 30 April 2025 |
327.01 (-0.72%) |
331.01 |
299.65 - 359.97 |
0.8298 times |
Mon 31 March 2025 |
329.39 (9.39%) |
302.81 |
299.88 - 338.33 |
0.6044 times |
Fri 28 February 2025 |
301.12 (-2.99%) |
308.72 |
262.32 - 327.41 |
0.836 times |

DMA SMA EMA moving averages of Molina Healthcare MOH
DMA (daily moving average) of Molina Healthcare MOH
| DMA period | DMA value | | 5 day DMA | 147.78 | | 12 day DMA | 144.57 | | 20 day DMA | 143.61 | | 35 day DMA | 154.59 | | 50 day DMA | 166.72 | | 100 day DMA | 170.27 | | 150 day DMA | 211.63 | | 200 day DMA | 238.6 | EMA (exponential moving average) of Molina Healthcare MOH
| EMA period | EMA current | EMA prev | EMA prev2 | | 5 day EMA | 148.1 | 146.86 | 145.74 | | 12 day EMA | 146.47 | 145.73 | 145.12 | | 20 day EMA | 148.19 | 147.94 | 147.82 | | 35 day EMA | 156.21 | 156.54 | 156.98 | | 50 day EMA | 165.86 | 166.48 | 167.19 |
SMA (simple moving average) of Molina Healthcare MOH
| SMA period | SMA current | SMA prev | SMA prev2 | | 5 day SMA | 147.78 | 147.33 | 146.87 | | 12 day SMA | 144.57 | 143.42 | 142.46 | | 20 day SMA | 143.61 | 143.57 | 143.7 | | 35 day SMA | 154.59 | 155.79 | 157.1 | | 50 day SMA | 166.72 | 167.36 | 168.01 | | 100 day SMA | 170.27 | 170.96 | 171.68 | | 150 day SMA | 211.63 | 212.76 | 213.9 | | 200 day SMA | 238.6 | 239.19 | 239.81 |
|
|
