MauiLand MLP full analysis,charts,indicators,moving averages,SMA,DMA,EMA,ADX,MACD,RSIMaui Land MLP WideScreen charts, DMA,SMA,EMA technical analysis, forecast prediction, by indicators ADX,MACD,RSI,CCI USA stock exchange
operates under Finance sector & deals in Real Estate
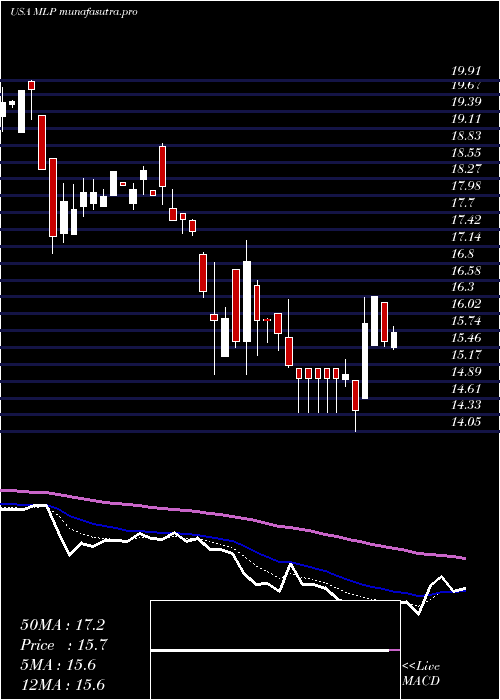
Daily price and charts and targets MauiLand Strong Daily Stock price targets for MauiLand MLP are 15.93 and 16.53 | Daily Target 1 | 15.51 | | Daily Target 2 | 15.74 | | Daily Target 3 | 16.11 | | Daily Target 4 | 16.34 | | Daily Target 5 | 16.71 |
Daily price and volume Maui Land
| Date |
Closing |
Open |
Range |
Volume |
Tue 21 October 2025 |
15.97 (-0.44%) |
15.88 |
15.88 - 16.48 |
0.481 times |
Mon 20 October 2025 |
16.04 (-0.56%) |
16.16 |
15.88 - 17.01 |
0.8466 times |
Fri 17 October 2025 |
16.13 (1.83%) |
15.75 |
15.75 - 16.56 |
1.0455 times |
Thu 16 October 2025 |
15.84 (-3.94%) |
16.38 |
15.84 - 16.55 |
1.0006 times |
Wed 15 October 2025 |
16.49 (0.55%) |
16.77 |
16.32 - 17.01 |
0.9557 times |
Tue 14 October 2025 |
16.40 (-2.61%) |
16.63 |
16.38 - 16.96 |
1.3084 times |
Mon 13 October 2025 |
16.84 (-2.66%) |
16.64 |
16.38 - 16.86 |
1.4239 times |
Tue 07 October 2025 |
17.30 (0.46%) |
17.17 |
17.00 - 17.50 |
1.6612 times |
Mon 06 October 2025 |
17.22 (-4.07%) |
17.90 |
17.12 - 17.92 |
0.6741 times |
Fri 03 October 2025 |
17.95 (0.67%) |
17.72 |
17.72 - 18.26 |
0.6029 times |
Thu 02 October 2025 |
17.83 (-0.11%) |
17.84 |
17.62 - 18.05 |
0.8052 times |
Weekly price and charts MauiLand Strong weekly Stock price targets for MauiLand MLP are 15.36 and 16.49 | Weekly Target 1 | 15.16 | | Weekly Target 2 | 15.56 | | Weekly Target 3 | 16.286666666667 | | Weekly Target 4 | 16.69 | | Weekly Target 5 | 17.42 |
Weekly price and volumes for Maui Land
| Date |
Closing |
Open |
Range |
Volume |
Tue 21 October 2025 |
15.97 (-0.99%) |
16.16 |
15.88 - 17.01 |
0.3265 times |
Fri 17 October 2025 |
16.13 (-6.76%) |
16.64 |
15.75 - 17.01 |
1.4102 times |
Tue 07 October 2025 |
17.30 (-3.62%) |
17.90 |
17.00 - 17.92 |
0.5743 times |
Fri 03 October 2025 |
17.95 (-5.68%) |
19.32 |
17.62 - 19.38 |
1.2044 times |
Fri 26 September 2025 |
19.03 (-0.16%) |
19.13 |
18.53 - 20.06 |
1.0395 times |
Fri 19 September 2025 |
19.06 (1.71%) |
18.89 |
18.20 - 20.34 |
1.8077 times |
Fri 12 September 2025 |
18.74 (10.3%) |
16.96 |
16.72 - 19.26 |
1.5521 times |
Fri 05 September 2025 |
16.99 (-2.24%) |
17.19 |
16.79 - 17.55 |
1.295 times |
Fri 29 August 2025 |
17.38 (0%) |
17.25 |
17.25 - 17.50 |
0.0946 times |
Fri 29 August 2025 |
17.38 (1.58%) |
17.02 |
16.41 - 17.50 |
0.6956 times |
Fri 22 August 2025 |
17.11 (-0.06%) |
17.35 |
15.65 - 17.35 |
2.2446 times |
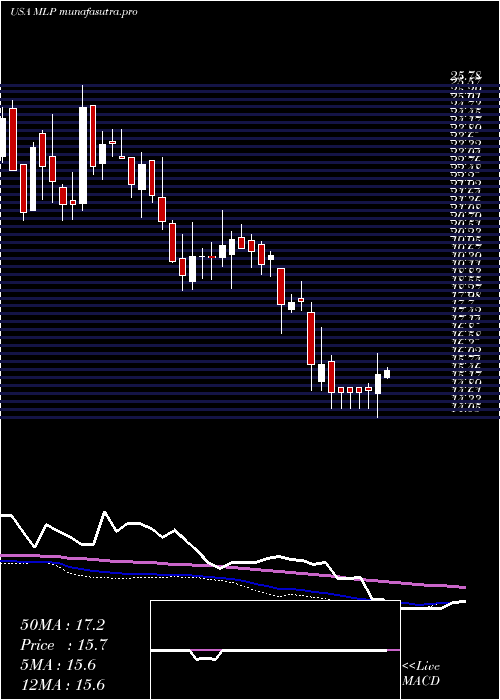
Monthly price and charts MauiLand Strong monthly Stock price targets for MauiLand MLP are 14.39 and 17.34 | Monthly Target 1 | 13.86 | | Monthly Target 2 | 14.91 | | Monthly Target 3 | 16.806666666667 | | Monthly Target 4 | 17.86 | | Monthly Target 5 | 19.76 |
Monthly price and volumes Maui Land
| Date |
Closing |
Open |
Range |
Volume |
Tue 21 October 2025 |
15.97 (-14.32%) |
18.42 |
15.75 - 18.70 |
0.5197 times |
Tue 30 September 2025 |
18.64 (7.25%) |
17.19 |
16.72 - 20.34 |
1.1434 times |
Fri 29 August 2025 |
17.38 (2.18%) |
16.79 |
15.65 - 17.61 |
0.9075 times |
Thu 31 July 2025 |
17.01 (-6.49%) |
18.07 |
15.85 - 18.70 |
0.8952 times |
Mon 30 June 2025 |
18.19 (14.55%) |
15.41 |
15.00 - 19.02 |
1.3161 times |
Fri 30 May 2025 |
15.88 (2.25%) |
15.42 |
14.52 - 17.56 |
1.2351 times |
Wed 30 April 2025 |
15.53 (-11.61%) |
17.69 |
14.05 - 17.69 |
1.1422 times |
Mon 31 March 2025 |
17.57 (-9.71%) |
19.63 |
17.02 - 19.91 |
0.8512 times |
Fri 28 February 2025 |
19.46 (-3.33%) |
19.80 |
18.61 - 20.87 |
0.6269 times |
Fri 31 January 2025 |
20.13 (-8.42%) |
22.02 |
18.52 - 22.23 |
1.3627 times |
Tue 31 December 2024 |
21.98 (-7.37%) |
23.20 |
21.03 - 23.41 |
1.0087 times |

DMA SMA EMA moving averages of Maui Land MLP
DMA (daily moving average) of Maui Land MLP
| DMA period | DMA value | | 5 day DMA | 16.09 | | 12 day DMA | 16.82 | | 20 day DMA | 17.71 | | 35 day DMA | 17.84 | | 50 day DMA | 17.54 | | 100 day DMA | 17.35 | | 150 day DMA | 16.93 | | 200 day DMA | 17.65 | EMA (exponential moving average) of Maui Land MLP
| EMA period | EMA current | EMA prev | EMA prev2 | | 5 day EMA | 16.18 | 16.28 | 16.4 | | 12 day EMA | 16.77 | 16.92 | 17.08 | | 20 day EMA | 17.19 | 17.32 | 17.45 | | 35 day EMA | 17.31 | 17.39 | 17.47 | | 50 day EMA | 17.33 | 17.39 | 17.44 |
SMA (simple moving average) of Maui Land MLP
| SMA period | SMA current | SMA prev | SMA prev2 | | 5 day SMA | 16.09 | 16.18 | 16.34 | | 12 day SMA | 16.82 | 17.04 | 17.28 | | 20 day SMA | 17.71 | 17.91 | 18.08 | | 35 day SMA | 17.84 | 17.88 | 17.91 | | 50 day SMA | 17.54 | 17.56 | 17.57 | | 100 day SMA | 17.35 | 17.35 | 17.35 | | 150 day SMA | 16.93 | 16.94 | 16.95 | | 200 day SMA | 17.65 | 17.68 | 17.7 |
|
|
