MuellerIndustries MLI full analysis,charts,indicators,moving averages,SMA,DMA,EMA,ADX,MACD,RSIMueller Industries MLI WideScreen charts, DMA,SMA,EMA technical analysis, forecast prediction, by indicators ADX,MACD,RSI,CCI USA stock exchange
operates under Capital Goods sector & deals in Metal Fabrications
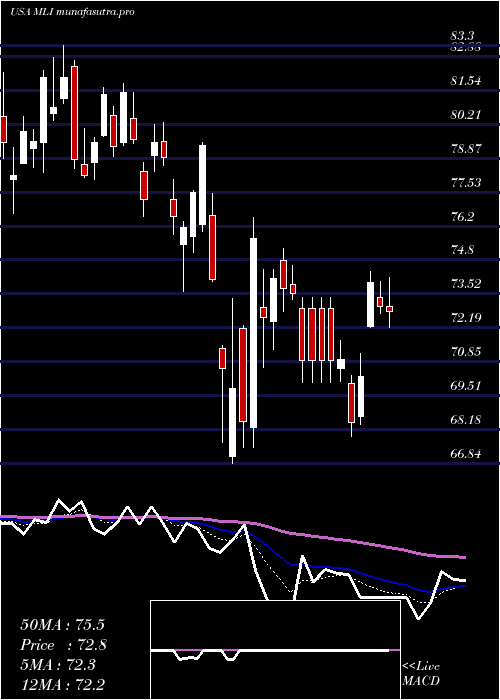
Daily price and charts and targets MuellerIndustries Strong Daily Stock price targets for MuellerIndustries MLI are 112.01 and 114.28 | Daily Target 1 | 110.16 | | Daily Target 2 | 111.59 | | Daily Target 3 | 112.43 | | Daily Target 4 | 113.86 | | Daily Target 5 | 114.7 |
Daily price and volume Mueller Industries
| Date |
Closing |
Open |
Range |
Volume |
Thu 04 December 2025 |
113.02 (1.27%) |
111.36 |
111.00 - 113.27 |
0.7181 times |
Wed 03 December 2025 |
111.60 (0.78%) |
111.01 |
110.94 - 113.15 |
1.1227 times |
Tue 02 December 2025 |
110.74 (0.98%) |
110.36 |
109.87 - 111.85 |
1.4253 times |
Mon 01 December 2025 |
109.67 (-0.18%) |
109.28 |
109.00 - 110.79 |
1.1016 times |
Fri 28 November 2025 |
109.87 (-0.46%) |
110.40 |
109.64 - 111.00 |
0.3741 times |
Wed 26 November 2025 |
110.38 (0.5%) |
109.58 |
109.54 - 111.39 |
0.6463 times |
Tue 25 November 2025 |
109.83 (1.69%) |
108.49 |
108.45 - 110.33 |
0.8256 times |
Mon 24 November 2025 |
108.00 (1.32%) |
106.58 |
105.91 - 109.14 |
0.9654 times |
Fri 21 November 2025 |
106.59 (1.97%) |
104.61 |
104.18 - 107.63 |
1.599 times |
Thu 20 November 2025 |
104.53 (-2.16%) |
108.36 |
104.30 - 109.17 |
1.2218 times |
Wed 19 November 2025 |
106.84 (1.14%) |
106.06 |
106.06 - 107.78 |
0.7315 times |
Weekly price and charts MuellerIndustries Strong weekly Stock price targets for MuellerIndustries MLI are 111.01 and 115.28 | Weekly Target 1 | 107.49 | | Weekly Target 2 | 110.26 | | Weekly Target 3 | 111.76333333333 | | Weekly Target 4 | 114.53 | | Weekly Target 5 | 116.03 |
Weekly price and volumes for Mueller Industries
| Date |
Closing |
Open |
Range |
Volume |
Thu 04 December 2025 |
113.02 (2.87%) |
109.28 |
109.00 - 113.27 |
1.1675 times |
Fri 28 November 2025 |
109.87 (3.08%) |
106.58 |
105.91 - 111.39 |
0.7515 times |
Fri 21 November 2025 |
106.59 (-0.31%) |
106.75 |
104.00 - 109.17 |
1.373 times |
Fri 14 November 2025 |
106.92 (-0.16%) |
107.60 |
105.94 - 109.90 |
0.9219 times |
Fri 07 November 2025 |
107.09 (1.15%) |
107.15 |
105.40 - 109.48 |
1.16 times |
Fri 31 October 2025 |
105.87 (0%) |
105.79 |
104.55 - 106.29 |
0.1876 times |
Fri 31 October 2025 |
105.87 (2.8%) |
103.90 |
102.40 - 107.74 |
1.3115 times |
Fri 24 October 2025 |
102.99 (4.48%) |
99.57 |
99.02 - 106.28 |
1.5845 times |
Fri 17 October 2025 |
98.57 (-0.11%) |
98.08 |
96.87 - 100.93 |
1.2063 times |
Tue 07 October 2025 |
98.68 (-1.81%) |
100.80 |
98.23 - 101.25 |
0.3362 times |
Fri 03 October 2025 |
100.50 (-0.89%) |
102.06 |
99.02 - 102.08 |
1.038 times |
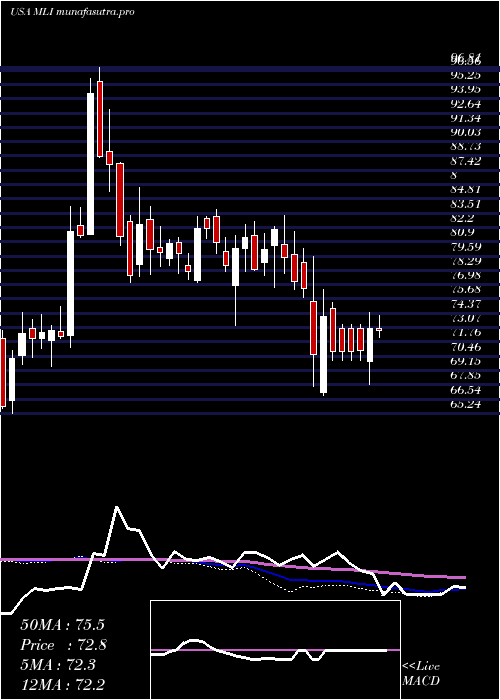
Monthly price and charts MuellerIndustries Strong monthly Stock price targets for MuellerIndustries MLI are 111.01 and 115.28 | Monthly Target 1 | 107.49 | | Monthly Target 2 | 110.26 | | Monthly Target 3 | 111.76333333333 | | Monthly Target 4 | 114.53 | | Monthly Target 5 | 116.03 |
Monthly price and volumes Mueller Industries
| Date |
Closing |
Open |
Range |
Volume |
Thu 04 December 2025 |
113.02 (2.87%) |
109.28 |
109.00 - 113.27 |
0.1762 times |
Fri 28 November 2025 |
109.87 (3.78%) |
107.15 |
104.00 - 111.39 |
0.6348 times |
Fri 31 October 2025 |
105.87 (4.71%) |
100.34 |
96.87 - 107.74 |
0.7919 times |
Tue 30 September 2025 |
101.11 (5.39%) |
94.86 |
94.22 - 102.75 |
1.0515 times |
Fri 29 August 2025 |
95.94 (12.38%) |
84.00 |
82.35 - 97.26 |
0.9007 times |
Thu 31 July 2025 |
85.37 (7.42%) |
79.30 |
78.57 - 89.04 |
1.2431 times |
Mon 30 June 2025 |
79.47 (2.05%) |
77.79 |
72.16 - 80.74 |
2.1477 times |
Fri 30 May 2025 |
77.87 (5.86%) |
73.93 |
73.09 - 80.55 |
0.82 times |
Wed 30 April 2025 |
73.56 (-3.39%) |
75.78 |
66.84 - 79.51 |
1.1013 times |
Mon 31 March 2025 |
76.14 (-5.04%) |
80.51 |
73.63 - 83.30 |
1.1328 times |
Fri 28 February 2025 |
80.18 (1.82%) |
76.88 |
73.25 - 82.73 |
0.8824 times |

DMA SMA EMA moving averages of Mueller Industries MLI
DMA (daily moving average) of Mueller Industries MLI
| DMA period | DMA value | | 5 day DMA | 110.98 | | 12 day DMA | 108.89 | | 20 day DMA | 108.21 | | 35 day DMA | 106.36 | | 50 day DMA | 104.49 | | 100 day DMA | 98.21 | | 150 day DMA | 91.33 | | 200 day DMA | 87.71 | EMA (exponential moving average) of Mueller Industries MLI
| EMA period | EMA current | EMA prev | EMA prev2 | | 5 day EMA | 111.25 | 110.37 | 109.75 | | 12 day EMA | 109.64 | 109.02 | 108.55 | | 20 day EMA | 108.43 | 107.95 | 107.57 | | 35 day EMA | 106.47 | 106.08 | 105.76 | | 50 day EMA | 104.72 | 104.38 | 104.09 |
SMA (simple moving average) of Mueller Industries MLI
| SMA period | SMA current | SMA prev | SMA prev2 | | 5 day SMA | 110.98 | 110.45 | 110.1 | | 12 day SMA | 108.89 | 108.21 | 107.82 | | 20 day SMA | 108.21 | 107.96 | 107.74 | | 35 day SMA | 106.36 | 105.97 | 105.63 | | 50 day SMA | 104.49 | 104.22 | 103.99 | | 100 day SMA | 98.21 | 97.94 | 97.67 | | 150 day SMA | 91.33 | 91.07 | 90.82 | | 200 day SMA | 87.71 | 87.54 | 87.39 |
|
|
