MesaLaboratories MLAB full analysis,charts,indicators,moving averages,SMA,DMA,EMA,ADX,MACD,RSIMesa Laboratories MLAB WideScreen charts, DMA,SMA,EMA technical analysis, forecast prediction, by indicators ADX,MACD,RSI,CCI USA stock exchange
operates under Capital Goods sector & deals in Industrial Machinery Components
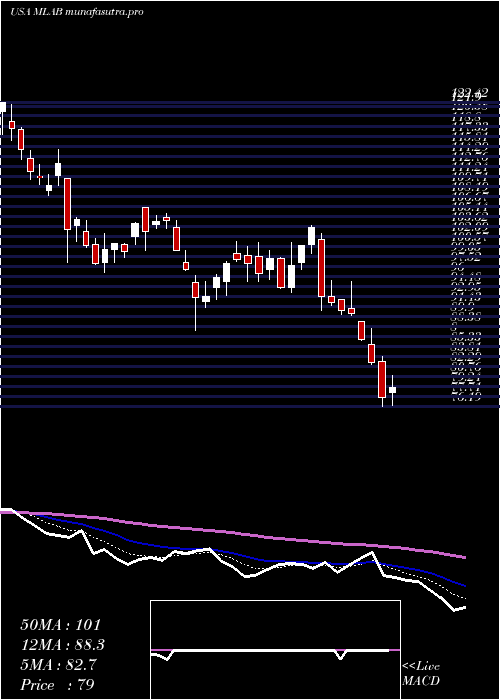
Daily price and charts and targets MesaLaboratories Strong Daily Stock price targets for MesaLaboratories MLAB are 76.35 and 81.11 | Daily Target 1 | 72.91 | | Daily Target 2 | 75.03 | | Daily Target 3 | 77.67 | | Daily Target 4 | 79.79 | | Daily Target 5 | 82.43 |
Daily price and volume Mesa Laboratories
| Date |
Closing |
Open |
Range |
Volume |
Thu 04 December 2025 |
77.15 (1.01%) |
76.22 |
75.55 - 80.31 |
0.5593 times |
Wed 03 December 2025 |
76.38 (0.42%) |
76.84 |
75.78 - 78.28 |
0.4975 times |
Tue 02 December 2025 |
76.06 (-3.33%) |
78.56 |
75.87 - 79.87 |
0.6789 times |
Mon 01 December 2025 |
78.68 (-1.9%) |
79.34 |
78.21 - 81.01 |
0.4949 times |
Fri 28 November 2025 |
80.20 (-0.39%) |
81.19 |
79.08 - 81.92 |
0.2522 times |
Wed 26 November 2025 |
80.51 (-0.81%) |
81.40 |
79.96 - 82.87 |
0.471 times |
Tue 25 November 2025 |
81.17 (4.41%) |
78.62 |
77.46 - 81.31 |
0.698 times |
Mon 24 November 2025 |
77.74 (10.11%) |
71.19 |
70.18 - 78.18 |
2.5789 times |
Fri 21 November 2025 |
70.60 (-1.4%) |
71.85 |
70.21 - 73.89 |
3.2195 times |
Thu 20 November 2025 |
71.60 (1.24%) |
71.26 |
70.20 - 73.97 |
0.5497 times |
Wed 19 November 2025 |
70.72 (0.16%) |
70.48 |
69.62 - 71.33 |
0.3797 times |
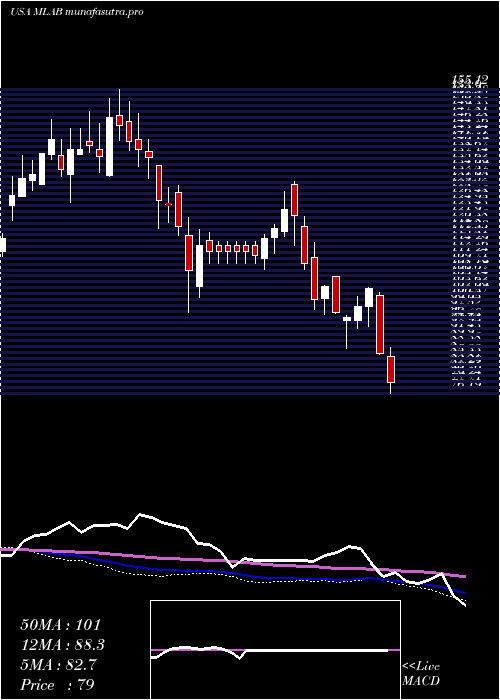
Weekly price and charts MesaLaboratories Strong weekly Stock price targets for MesaLaboratories MLAB are 73.62 and 79.08 | Weekly Target 1 | 72.44 | | Weekly Target 2 | 74.8 | | Weekly Target 3 | 77.903333333333 | | Weekly Target 4 | 80.26 | | Weekly Target 5 | 83.36 |
Weekly price and volumes for Mesa Laboratories
| Date |
Closing |
Open |
Range |
Volume |
Thu 04 December 2025 |
77.15 (-3.8%) |
79.34 |
75.55 - 81.01 |
0.8855 times |
Fri 28 November 2025 |
80.20 (13.6%) |
71.19 |
70.18 - 82.87 |
1.5879 times |
Fri 21 November 2025 |
70.60 (-4.52%) |
74.52 |
69.51 - 74.52 |
2.2203 times |
Fri 14 November 2025 |
73.94 (-2.72%) |
76.34 |
73.30 - 82.37 |
0.9005 times |
Fri 07 November 2025 |
76.01 (5.73%) |
72.51 |
70.00 - 79.97 |
1.0809 times |
Fri 31 October 2025 |
71.89 (0%) |
75.88 |
70.13 - 76.65 |
0.2287 times |
Fri 31 October 2025 |
71.89 (-9.2%) |
79.43 |
70.13 - 80.50 |
0.7786 times |
Fri 24 October 2025 |
79.17 (8.33%) |
73.62 |
72.65 - 80.84 |
0.5892 times |
Fri 17 October 2025 |
73.08 (7.9%) |
68.91 |
66.56 - 75.00 |
0.7565 times |
Fri 10 October 2025 |
67.73 (-7.56%) |
74.25 |
66.94 - 75.77 |
0.9719 times |
Fri 03 October 2025 |
73.27 (13.58%) |
65.01 |
63.48 - 75.10 |
0.9743 times |
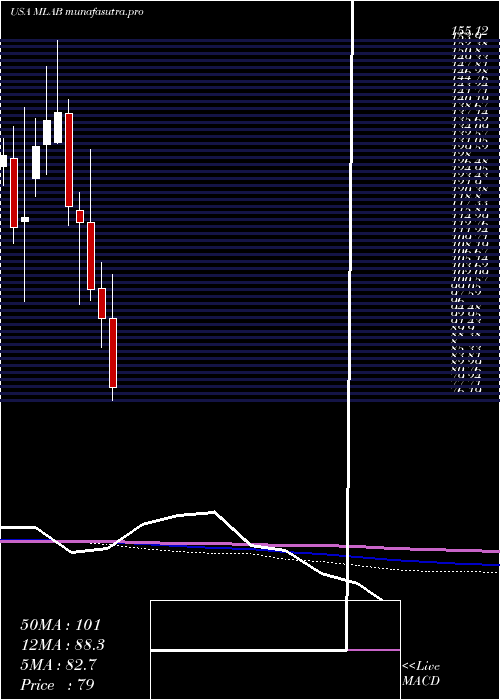
Monthly price and charts MesaLaboratories Strong monthly Stock price targets for MesaLaboratories MLAB are 73.62 and 79.08 | Monthly Target 1 | 72.44 | | Monthly Target 2 | 74.8 | | Monthly Target 3 | 77.903333333333 | | Monthly Target 4 | 80.26 | | Monthly Target 5 | 83.36 |
Monthly price and volumes Mesa Laboratories
| Date |
Closing |
Open |
Range |
Volume |
Thu 04 December 2025 |
77.15 (-3.8%) |
79.34 |
75.55 - 81.01 |
0.2236 times |
Fri 28 November 2025 |
80.20 (11.56%) |
72.51 |
69.51 - 82.87 |
1.4618 times |
Fri 31 October 2025 |
71.89 (7.28%) |
66.52 |
66.52 - 80.84 |
0.9673 times |
Tue 30 September 2025 |
67.01 (-1.09%) |
66.79 |
58.83 - 75.61 |
1.8762 times |
Fri 29 August 2025 |
67.75 (-11.41%) |
75.22 |
55.45 - 75.91 |
1.1035 times |
Thu 31 July 2025 |
76.48 (-18.83%) |
94.22 |
67.95 - 103.73 |
1.3653 times |
Mon 30 June 2025 |
94.22 (-6.36%) |
100.86 |
87.80 - 106.40 |
1.8433 times |
Fri 30 May 2025 |
100.62 (-12.69%) |
115.34 |
98.06 - 131.20 |
0.364 times |
Wed 30 April 2025 |
115.25 (-2.87%) |
117.85 |
97.20 - 121.91 |
0.431 times |
Mon 31 March 2025 |
118.66 (-14.87%) |
139.09 |
114.67 - 142.19 |
0.3639 times |
Fri 28 February 2025 |
139.38 (1.23%) |
132.88 |
132.50 - 155.12 |
0.2924 times |
DMA SMA EMA moving averages of Mesa Laboratories MLAB
DMA (daily moving average) of Mesa Laboratories MLAB
| DMA period | DMA value | | 5 day DMA | 77.69 | | 12 day DMA | 75.95 | | 20 day DMA | 76.28 | | 35 day DMA | 76.09 | | 50 day DMA | 73.97 | | 100 day DMA | 71.22 | | 150 day DMA | 82.41 | | 200 day DMA | 92.47 | EMA (exponential moving average) of Mesa Laboratories MLAB
| EMA period | EMA current | EMA prev | EMA prev2 | | 5 day EMA | 77.23 | 77.27 | 77.72 | | 12 day EMA | 76.8 | 76.74 | 76.8 | | 20 day EMA | 76.25 | 76.16 | 76.14 | | 35 day EMA | 75.07 | 74.95 | 74.87 | | 50 day EMA | 74.05 | 73.92 | 73.82 |
SMA (simple moving average) of Mesa Laboratories MLAB
| SMA period | SMA current | SMA prev | SMA prev2 | | 5 day SMA | 77.69 | 78.37 | 79.32 | | 12 day SMA | 75.95 | 75.49 | 75.29 | | 20 day SMA | 76.28 | 76.13 | 76 | | 35 day SMA | 76.09 | 75.91 | 75.77 | | 50 day SMA | 73.97 | 73.76 | 73.63 | | 100 day SMA | 71.22 | 71.22 | 71.29 | | 150 day SMA | 82.41 | 82.66 | 82.93 | | 200 day SMA | 92.47 | 92.83 | 93.18 |
|
|
