MccormickCompany MKC full analysis,charts,indicators,moving averages,SMA,DMA,EMA,ADX,MACD,RSIMccormick Company MKC WideScreen charts, DMA,SMA,EMA technical analysis, forecast prediction, by indicators ADX,MACD,RSI,CCI USA stock exchange
operates under Consumer Non Durables sector & deals in Packaged Foods
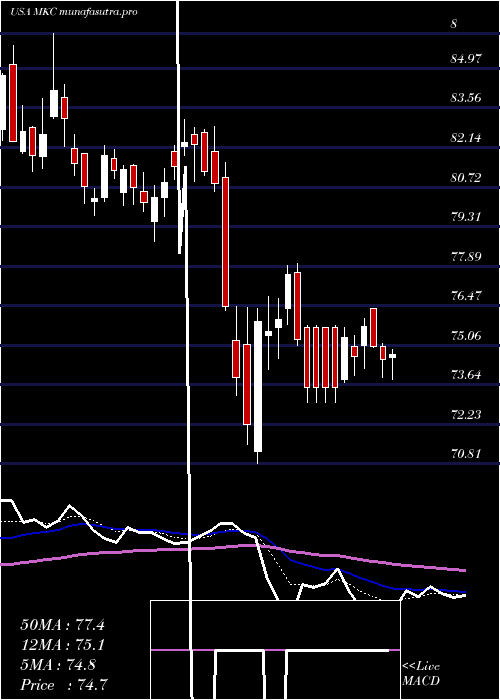
Daily price and charts and targets MccormickCompany Strong Daily Stock price targets for MccormickCompany MKC are 67.54 and 68.12 | Daily Target 1 | 67.08 | | Daily Target 2 | 67.42 | | Daily Target 3 | 67.663333333333 | | Daily Target 4 | 68 | | Daily Target 5 | 68.24 |
Daily price and volume Mccormick Company
| Date |
Closing |
Open |
Range |
Volume |
Mon 20 October 2025 |
67.75 (0.31%) |
67.54 |
67.33 - 67.91 |
0.5858 times |
Fri 17 October 2025 |
67.54 (1.41%) |
67.00 |
66.35 - 67.61 |
0.6444 times |
Thu 16 October 2025 |
66.60 (1.99%) |
65.51 |
65.40 - 66.92 |
0.93 times |
Wed 15 October 2025 |
65.30 (-0.76%) |
65.52 |
64.83 - 66.17 |
0.6909 times |
Tue 14 October 2025 |
65.80 (0.67%) |
64.65 |
64.09 - 65.88 |
0.8151 times |
Mon 13 October 2025 |
65.36 (-0.4%) |
66.37 |
65.32 - 66.70 |
0.776 times |
Tue 07 October 2025 |
65.62 (-5.16%) |
67.45 |
65.60 - 69.13 |
2.0201 times |
Mon 06 October 2025 |
69.19 (0.41%) |
69.05 |
67.55 - 69.86 |
1.4911 times |
Fri 03 October 2025 |
68.91 (1.2%) |
67.87 |
67.87 - 69.01 |
1.3128 times |
Thu 02 October 2025 |
68.09 (0.49%) |
67.76 |
67.10 - 68.21 |
0.7338 times |
Wed 01 October 2025 |
67.76 (1.27%) |
66.91 |
66.78 - 68.04 |
0.9596 times |
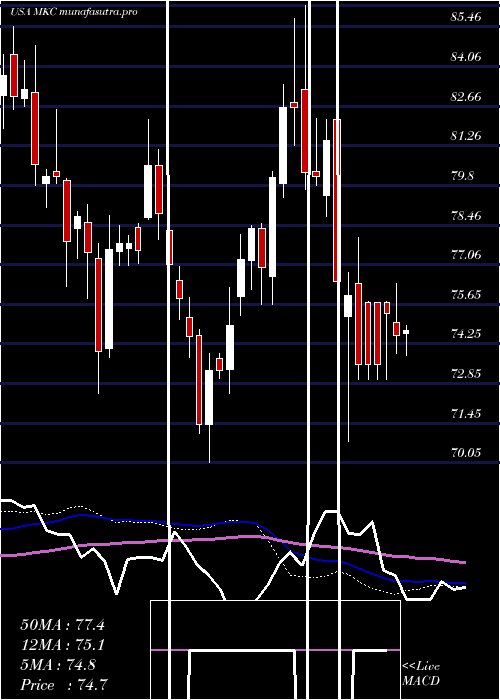
Weekly price and charts MccormickCompany Strong weekly Stock price targets for MccormickCompany MKC are 67.54 and 68.12 | Weekly Target 1 | 67.08 | | Weekly Target 2 | 67.42 | | Weekly Target 3 | 67.663333333333 | | Weekly Target 4 | 68 | | Weekly Target 5 | 68.24 |
Weekly price and volumes for Mccormick Company
| Date |
Closing |
Open |
Range |
Volume |
Mon 20 October 2025 |
67.75 (0.31%) |
67.54 |
67.33 - 67.91 |
0.1709 times |
Fri 17 October 2025 |
67.54 (2.93%) |
66.37 |
64.09 - 67.61 |
1.1253 times |
Tue 07 October 2025 |
65.62 (-4.77%) |
69.05 |
65.60 - 69.86 |
1.0245 times |
Fri 03 October 2025 |
68.91 (4.89%) |
65.60 |
64.89 - 69.01 |
1.563 times |
Fri 26 September 2025 |
65.70 (0.34%) |
65.10 |
63.66 - 66.00 |
1.4495 times |
Fri 19 September 2025 |
65.48 (-5.03%) |
69.34 |
65.47 - 69.54 |
1.2974 times |
Fri 12 September 2025 |
68.95 (-2.76%) |
70.50 |
67.71 - 70.52 |
1.0201 times |
Fri 05 September 2025 |
70.91 (0.77%) |
70.38 |
68.38 - 71.63 |
0.8475 times |
Fri 29 August 2025 |
70.37 (0%) |
69.99 |
69.72 - 70.70 |
0.2417 times |
Fri 29 August 2025 |
70.37 (-2.62%) |
71.90 |
68.68 - 71.90 |
1.26 times |
Fri 22 August 2025 |
72.26 (3.67%) |
69.70 |
68.23 - 72.58 |
1.4455 times |
Monthly price and charts MccormickCompany Strong monthly Stock price targets for MccormickCompany MKC are 65.92 and 71.69 | Monthly Target 1 | 61.46 | | Monthly Target 2 | 64.61 | | Monthly Target 3 | 67.233333333333 | | Monthly Target 4 | 70.38 | | Monthly Target 5 | 73 |
Monthly price and volumes Mccormick Company
| Date |
Closing |
Open |
Range |
Volume |
Mon 20 October 2025 |
67.75 (1.26%) |
66.91 |
64.09 - 69.86 |
0.7088 times |
Tue 30 September 2025 |
66.91 (-4.92%) |
70.38 |
63.66 - 71.63 |
1.1748 times |
Fri 29 August 2025 |
70.37 (-0.37%) |
70.99 |
68.23 - 72.58 |
1.0845 times |
Thu 31 July 2025 |
70.63 (-6.85%) |
75.77 |
70.25 - 78.03 |
1.0615 times |
Mon 30 June 2025 |
75.82 (4.25%) |
72.30 |
71.42 - 78.16 |
1.0063 times |
Fri 30 May 2025 |
72.73 (-5.13%) |
75.75 |
69.98 - 77.30 |
1.1336 times |
Wed 30 April 2025 |
76.66 (-6.86%) |
82.61 |
70.81 - 82.90 |
1.0381 times |
Mon 31 March 2025 |
82.31 (-0.36%) |
82.79 |
78.76 - 86.24 |
1.0193 times |
Fri 28 February 2025 |
82.61 (6.97%) |
77.20 |
75.66 - 83.44 |
0.7636 times |
Fri 31 January 2025 |
77.23 (1.3%) |
76.51 |
70.05 - 78.12 |
1.0096 times |
Tue 31 December 2024 |
76.24 (-2.02%) |
78.37 |
75.12 - 82.20 |
0.6162 times |

DMA SMA EMA moving averages of Mccormick Company MKC
DMA (daily moving average) of Mccormick Company MKC
| DMA period | DMA value | | 5 day DMA | 66.6 | | 12 day DMA | 67.07 | | 20 day DMA | 66.39 | | 35 day DMA | 67.57 | | 50 day DMA | 68.34 | | 100 day DMA | 70.67 | | 150 day DMA | 72.73 | | 200 day DMA | 73.88 | EMA (exponential moving average) of Mccormick Company MKC
| EMA period | EMA current | EMA prev | EMA prev2 | | 5 day EMA | 67.02 | 66.66 | 66.22 | | 12 day EMA | 66.84 | 66.68 | 66.52 | | 20 day EMA | 66.99 | 66.91 | 66.84 | | 35 day EMA | 67.57 | 67.56 | 67.56 | | 50 day EMA | 68.35 | 68.37 | 68.4 |
SMA (simple moving average) of Mccormick Company MKC
| SMA period | SMA current | SMA prev | SMA prev2 | | 5 day SMA | 66.6 | 66.12 | 65.74 | | 12 day SMA | 67.07 | 66.99 | 66.84 | | 20 day SMA | 66.39 | 66.34 | 66.32 | | 35 day SMA | 67.57 | 67.66 | 67.74 | | 50 day SMA | 68.34 | 68.38 | 68.42 | | 100 day SMA | 70.67 | 70.72 | 70.79 | | 150 day SMA | 72.73 | 72.83 | 72.94 | | 200 day SMA | 73.88 | 73.92 | 73.98 |
|
|
