BlackrockMuniyield MIY full analysis,charts,indicators,moving averages,SMA,DMA,EMA,ADX,MACD,RSIBlackrock Muniyield MIY WideScreen charts, DMA,SMA,EMA technical analysis, forecast prediction, by indicators ADX,MACD,RSI,CCI USA stock exchange
operates under N A sector & deals in N A
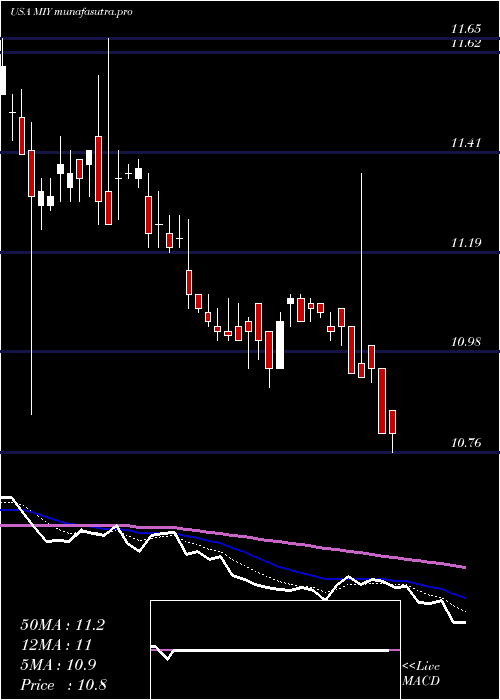
Daily price and charts and targets BlackrockMuniyield Strong Daily Stock price targets for BlackrockMuniyield MIY are 11.74 and 11.79 | Daily Target 1 | 11.72 | | Daily Target 2 | 11.75 | | Daily Target 3 | 11.773333333333 | | Daily Target 4 | 11.8 | | Daily Target 5 | 11.82 |
Daily price and volume Blackrock Muniyield
| Date |
Closing |
Open |
Range |
Volume |
Fri 05 December 2025 |
11.77 (-0.17%) |
11.79 |
11.75 - 11.80 |
1.2361 times |
Thu 04 December 2025 |
11.79 (0.17%) |
11.77 |
11.66 - 11.79 |
0.5981 times |
Wed 03 December 2025 |
11.77 (0.51%) |
11.71 |
11.62 - 11.77 |
2.056 times |
Tue 02 December 2025 |
11.71 (0.09%) |
11.68 |
11.63 - 11.72 |
1.6288 times |
Mon 01 December 2025 |
11.70 (-0.09%) |
11.68 |
11.60 - 11.70 |
1.2798 times |
Fri 28 November 2025 |
11.71 (0.52%) |
11.65 |
11.65 - 11.71 |
0.7617 times |
Wed 26 November 2025 |
11.65 (0.17%) |
11.60 |
11.60 - 11.65 |
0.5926 times |
Tue 25 November 2025 |
11.63 (1.13%) |
11.56 |
11.54 - 11.63 |
0.8617 times |
Mon 24 November 2025 |
11.50 (0.26%) |
11.45 |
11.45 - 11.54 |
0.6362 times |
Fri 21 November 2025 |
11.47 (-0.43%) |
11.48 |
11.45 - 11.52 |
0.349 times |
Thu 20 November 2025 |
11.52 (-0.6%) |
11.60 |
11.45 - 11.60 |
0.8671 times |
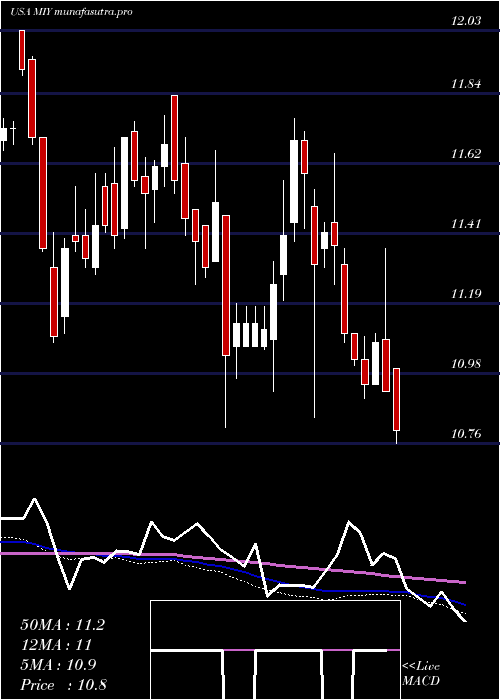
Weekly price and charts BlackrockMuniyield Strong weekly Stock price targets for BlackrockMuniyield MIY are 11.69 and 11.89 | Weekly Target 1 | 11.52 | | Weekly Target 2 | 11.65 | | Weekly Target 3 | 11.723333333333 | | Weekly Target 4 | 11.85 | | Weekly Target 5 | 11.92 |
Weekly price and volumes for Blackrock Muniyield
| Date |
Closing |
Open |
Range |
Volume |
Fri 05 December 2025 |
11.77 (0.51%) |
11.68 |
11.60 - 11.80 |
1.513 times |
Fri 28 November 2025 |
11.71 (2.09%) |
11.45 |
11.45 - 11.71 |
0.6347 times |
Fri 21 November 2025 |
11.47 (-0.35%) |
11.51 |
11.45 - 11.67 |
1.2804 times |
Fri 14 November 2025 |
11.51 (-0.78%) |
11.64 |
11.42 - 11.66 |
1.0963 times |
Fri 07 November 2025 |
11.60 (0.61%) |
11.51 |
11.50 - 11.66 |
0.7132 times |
Fri 31 October 2025 |
11.53 (0%) |
11.52 |
11.48 - 11.53 |
0.2265 times |
Fri 31 October 2025 |
11.53 (0.17%) |
11.46 |
11.37 - 11.53 |
1.07 times |
Fri 24 October 2025 |
11.51 (0.52%) |
11.43 |
11.40 - 11.62 |
1.3111 times |
Fri 17 October 2025 |
11.45 (1.06%) |
11.46 |
11.40 - 11.59 |
1.1643 times |
Tue 07 October 2025 |
11.33 (0.53%) |
11.27 |
11.22 - 11.35 |
0.9904 times |
Fri 03 October 2025 |
11.27 (0.63%) |
11.20 |
11.19 - 11.39 |
1.6173 times |
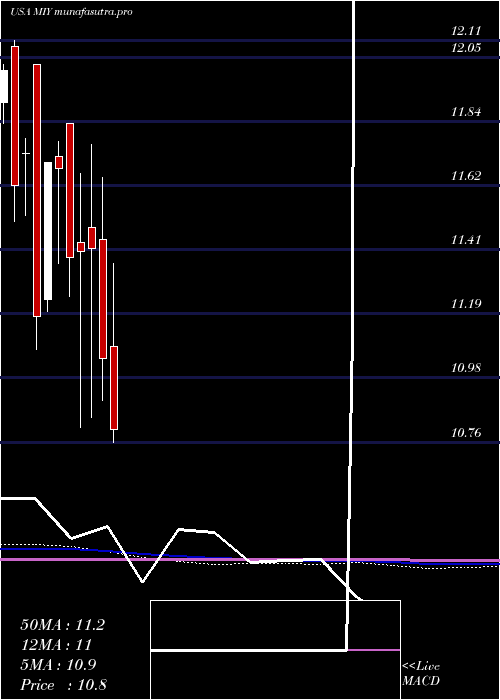
Monthly price and charts BlackrockMuniyield Strong monthly Stock price targets for BlackrockMuniyield MIY are 11.69 and 11.89 | Monthly Target 1 | 11.52 | | Monthly Target 2 | 11.65 | | Monthly Target 3 | 11.723333333333 | | Monthly Target 4 | 11.85 | | Monthly Target 5 | 11.92 |
Monthly price and volumes Blackrock Muniyield
| Date |
Closing |
Open |
Range |
Volume |
Fri 05 December 2025 |
11.77 (0.51%) |
11.68 |
11.60 - 11.80 |
0.3419 times |
Fri 28 November 2025 |
11.71 (1.56%) |
11.51 |
11.42 - 11.71 |
0.8418 times |
Fri 31 October 2025 |
11.53 (2.22%) |
11.35 |
11.19 - 11.62 |
1.353 times |
Tue 30 September 2025 |
11.28 (0.98%) |
11.15 |
11.07 - 11.50 |
1.0512 times |
Fri 29 August 2025 |
11.17 (2.38%) |
10.90 |
10.90 - 11.35 |
1.1895 times |
Thu 31 July 2025 |
10.91 (-1.18%) |
11.08 |
10.57 - 11.36 |
1.2794 times |
Mon 30 June 2025 |
11.04 (-3.24%) |
11.44 |
10.90 - 11.65 |
1.014 times |
Fri 30 May 2025 |
11.41 (0.09%) |
11.48 |
10.84 - 11.76 |
0.9084 times |
Wed 30 April 2025 |
11.40 (0.18%) |
11.43 |
10.81 - 11.66 |
1.149 times |
Mon 31 March 2025 |
11.38 (-2.57%) |
11.83 |
11.25 - 11.83 |
0.8719 times |
Fri 28 February 2025 |
11.68 (-0.17%) |
11.72 |
11.36 - 11.77 |
0.7146 times |
DMA SMA EMA moving averages of Blackrock Muniyield MIY
DMA (daily moving average) of Blackrock Muniyield MIY
| DMA period | DMA value | | 5 day DMA | 11.75 | | 12 day DMA | 11.65 | | 20 day DMA | 11.62 | | 35 day DMA | 11.57 | | 50 day DMA | 11.5 | | 100 day DMA | 11.31 | | 150 day DMA | 11.3 | | 200 day DMA | 11.32 | EMA (exponential moving average) of Blackrock Muniyield MIY
| EMA period | EMA current | EMA prev | EMA prev2 | | 5 day EMA | 11.74 | 11.73 | 11.7 | | 12 day EMA | 11.69 | 11.67 | 11.65 | | 20 day EMA | 11.64 | 11.63 | 11.61 | | 35 day EMA | 11.57 | 11.56 | 11.55 | | 50 day EMA | 11.52 | 11.51 | 11.5 |
SMA (simple moving average) of Blackrock Muniyield MIY
| SMA period | SMA current | SMA prev | SMA prev2 | | 5 day SMA | 11.75 | 11.74 | 11.71 | | 12 day SMA | 11.65 | 11.64 | 11.61 | | 20 day SMA | 11.62 | 11.62 | 11.6 | | 35 day SMA | 11.57 | 11.56 | 11.55 | | 50 day SMA | 11.5 | 11.49 | 11.49 | | 100 day SMA | 11.31 | 11.3 | 11.29 | | 150 day SMA | 11.3 | 11.29 | 11.29 | | 200 day SMA | 11.32 | 11.32 | 11.32 |
|
|
