MiddlebyCorporation MIDD full analysis,charts,indicators,moving averages,SMA,DMA,EMA,ADX,MACD,RSIMiddleby Corporation MIDD WideScreen charts, DMA,SMA,EMA technical analysis, forecast prediction, by indicators ADX,MACD,RSI,CCI USA stock exchange
operates under Technology sector & deals in Industrial Machinery Components
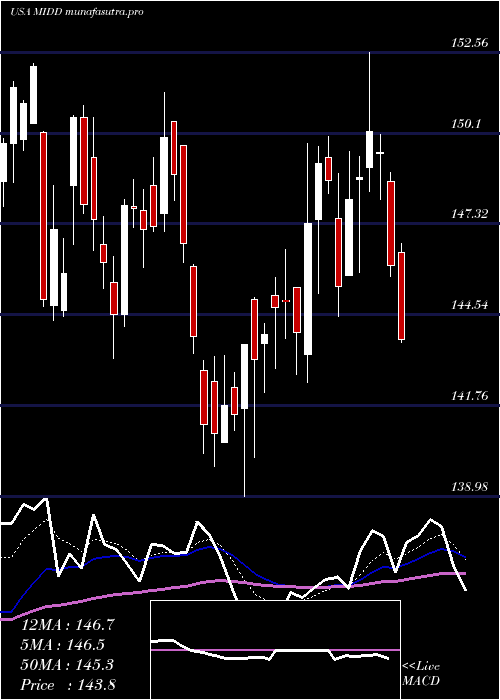
Daily price and charts and targets MiddlebyCorporation Strong Daily Stock price targets for MiddlebyCorporation MIDD are 134.51 and 137.89 | Daily Target 1 | 131.95 | | Daily Target 2 | 133.69 | | Daily Target 3 | 135.33 | | Daily Target 4 | 137.07 | | Daily Target 5 | 138.71 |
Daily price and volume Middleby Corporation
| Date |
Closing |
Open |
Range |
Volume |
Tue 21 October 2025 |
135.43 (0.7%) |
133.59 |
133.59 - 136.97 |
0.8632 times |
Mon 20 October 2025 |
134.49 (0.82%) |
134.71 |
133.55 - 135.33 |
0.6176 times |
Fri 17 October 2025 |
133.39 (-0.48%) |
133.15 |
132.35 - 134.44 |
0.5652 times |
Thu 16 October 2025 |
134.03 (0.21%) |
134.63 |
132.11 - 134.63 |
0.918 times |
Wed 15 October 2025 |
133.75 (-0.17%) |
134.56 |
132.11 - 135.46 |
0.55 times |
Tue 14 October 2025 |
133.98 (1.57%) |
129.62 |
129.62 - 134.56 |
0.8572 times |
Mon 13 October 2025 |
131.91 (2.16%) |
130.55 |
129.97 - 132.02 |
0.9696 times |
Fri 10 October 2025 |
129.12 (-2.7%) |
132.89 |
128.69 - 133.66 |
0.934 times |
Thu 09 October 2025 |
132.70 (-1.82%) |
135.45 |
131.13 - 135.45 |
1.6218 times |
Wed 08 October 2025 |
135.16 (-1.59%) |
136.92 |
132.47 - 137.60 |
2.1035 times |
Tue 07 October 2025 |
137.34 (-1.77%) |
140.63 |
136.93 - 140.77 |
1.2281 times |
Weekly price and charts MiddlebyCorporation Strong weekly Stock price targets for MiddlebyCorporation MIDD are 134.49 and 137.91 | Weekly Target 1 | 131.9 | | Weekly Target 2 | 133.66 | | Weekly Target 3 | 135.31666666667 | | Weekly Target 4 | 137.08 | | Weekly Target 5 | 138.74 |
Weekly price and volumes for Middleby Corporation
| Date |
Closing |
Open |
Range |
Volume |
Tue 21 October 2025 |
135.43 (1.53%) |
134.71 |
133.55 - 136.97 |
0.2298 times |
Fri 17 October 2025 |
133.39 (3.31%) |
130.55 |
129.62 - 135.46 |
0.599 times |
Fri 10 October 2025 |
129.12 (-6.84%) |
138.22 |
128.69 - 140.77 |
1.0633 times |
Fri 03 October 2025 |
138.60 (4.2%) |
134.02 |
131.10 - 140.28 |
0.9609 times |
Fri 26 September 2025 |
133.01 (-1.36%) |
133.89 |
130.75 - 136.53 |
0.8437 times |
Fri 19 September 2025 |
134.85 (0.19%) |
135.00 |
132.20 - 137.99 |
1.8082 times |
Fri 12 September 2025 |
134.59 (-6.81%) |
144.65 |
134.30 - 146.18 |
1.3142 times |
Fri 05 September 2025 |
144.43 (5.54%) |
134.87 |
134.55 - 145.77 |
1.2854 times |
Fri 29 August 2025 |
136.85 (0%) |
136.95 |
135.74 - 137.95 |
0.3007 times |
Fri 29 August 2025 |
136.85 (-0.34%) |
136.15 |
134.16 - 138.72 |
1.5949 times |
Fri 22 August 2025 |
137.31 (3.54%) |
132.44 |
129.18 - 137.65 |
1.4356 times |
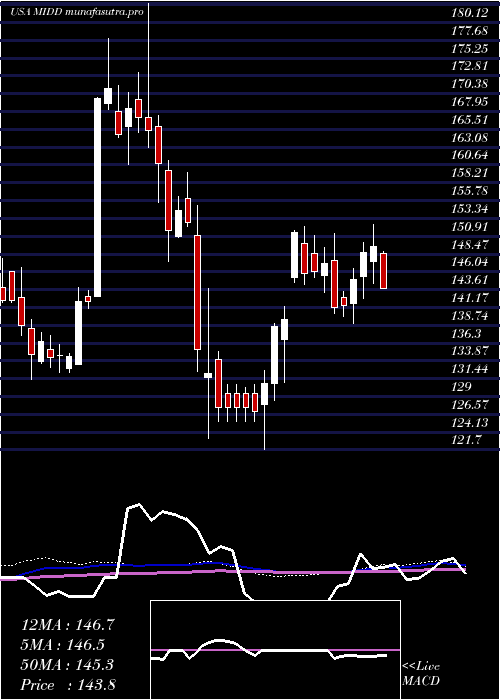
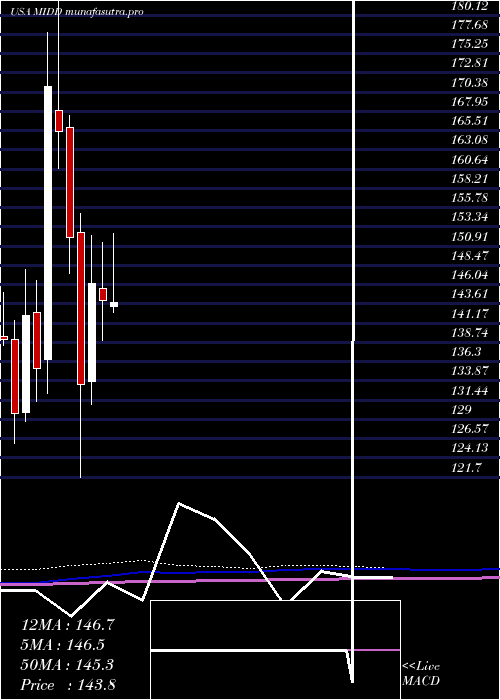
Monthly price and charts MiddlebyCorporation Strong monthly Stock price targets for MiddlebyCorporation MIDD are 132.06 and 144.14 | Monthly Target 1 | 122.88 | | Monthly Target 2 | 129.16 | | Monthly Target 3 | 134.96333333333 | | Monthly Target 4 | 141.24 | | Monthly Target 5 | 147.04 |
Monthly price and volumes Middleby Corporation
| Date |
Closing |
Open |
Range |
Volume |
Tue 21 October 2025 |
135.43 (1.88%) |
132.84 |
128.69 - 140.77 |
0.3853 times |
Tue 30 September 2025 |
132.93 (-2.86%) |
134.87 |
130.75 - 146.18 |
0.8921 times |
Fri 29 August 2025 |
136.85 (-5.75%) |
142.90 |
118.09 - 145.57 |
1.5279 times |
Thu 31 July 2025 |
145.20 (0.83%) |
143.31 |
140.72 - 152.56 |
1.0511 times |
Mon 30 June 2025 |
144.00 (-1.46%) |
145.54 |
138.98 - 151.34 |
0.8636 times |
Fri 30 May 2025 |
146.13 (9.58%) |
133.82 |
130.90 - 152.22 |
1.1767 times |
Wed 30 April 2025 |
133.35 (-12.26%) |
152.64 |
121.70 - 155.07 |
1.2639 times |
Mon 31 March 2025 |
151.98 (-8.12%) |
165.87 |
147.50 - 167.43 |
0.8099 times |
Fri 28 February 2025 |
165.41 (-3.35%) |
168.00 |
160.68 - 182.73 |
0.8879 times |
Fri 31 January 2025 |
171.14 (26.35%) |
136.52 |
132.23 - 177.90 |
1.1417 times |
Tue 31 December 2024 |
135.45 (-4.73%) |
142.50 |
131.26 - 146.61 |
0.5531 times |
DMA SMA EMA moving averages of Middleby Corporation MIDD
DMA (daily moving average) of Middleby Corporation MIDD
| DMA period | DMA value | | 5 day DMA | 134.22 | | 12 day DMA | 134.26 | | 20 day DMA | 134.34 | | 35 day DMA | 135.48 | | 50 day DMA | 135.32 | | 100 day DMA | 139.49 | | 150 day DMA | 139.7 | | 200 day DMA | 144.13 | EMA (exponential moving average) of Middleby Corporation MIDD
| EMA period | EMA current | EMA prev | EMA prev2 | | 5 day EMA | 134.38 | 133.85 | 133.53 | | 12 day EMA | 134.25 | 134.03 | 133.95 | | 20 day EMA | 134.34 | 134.23 | 134.2 | | 35 day EMA | 134.17 | 134.1 | 134.08 | | 50 day EMA | 134.09 | 134.04 | 134.02 |
SMA (simple moving average) of Middleby Corporation MIDD
| SMA period | SMA current | SMA prev | SMA prev2 | | 5 day SMA | 134.22 | 133.93 | 133.41 | | 12 day SMA | 134.26 | 134.52 | 134.78 | | 20 day SMA | 134.34 | 134.27 | 134.27 | | 35 day SMA | 135.48 | 135.53 | 135.6 | | 50 day SMA | 135.32 | 135.21 | 134.92 | | 100 day SMA | 139.49 | 139.61 | 139.77 | | 150 day SMA | 139.7 | 139.82 | 139.93 | | 200 day SMA | 144.13 | 144.12 | 144.12 |
|
|
