McgrathRentcorp MGRC full analysis,charts,indicators,moving averages,SMA,DMA,EMA,ADX,MACD,RSIMcgrath Rentcorp MGRC WideScreen charts, DMA,SMA,EMA technical analysis, forecast prediction, by indicators ADX,MACD,RSI,CCI USA stock exchange
operates under Technology sector & deals in Diversified Commercial Services
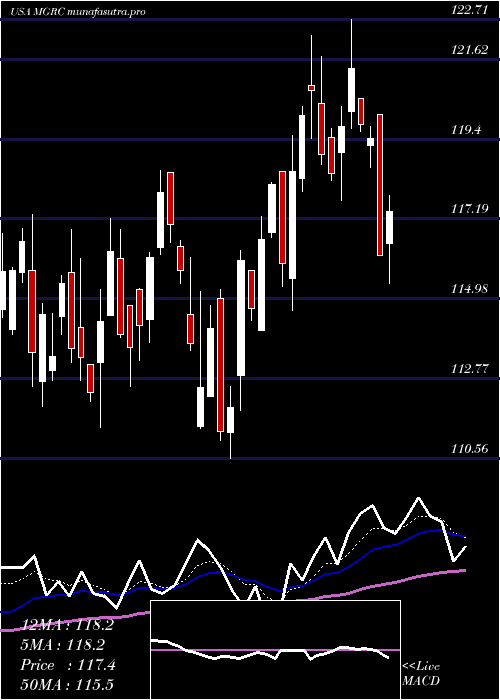
Daily price and charts and targets McgrathRentcorp Strong Daily Stock price targets for McgrathRentcorp MGRC are 118.75 and 121.24 | Daily Target 1 | 116.7 | | Daily Target 2 | 118.3 | | Daily Target 3 | 119.18666666667 | | Daily Target 4 | 120.79 | | Daily Target 5 | 121.68 |
Daily price and volume Mcgrath Rentcorp
| Date |
Closing |
Open |
Range |
Volume |
Mon 20 October 2025 |
119.91 (0.81%) |
118.55 |
117.58 - 120.07 |
0.8113 times |
Fri 17 October 2025 |
118.95 (1.02%) |
117.21 |
116.03 - 119.72 |
1.2275 times |
Thu 16 October 2025 |
117.75 (-1.23%) |
120.12 |
117.34 - 120.61 |
0.8526 times |
Wed 15 October 2025 |
119.22 (2.16%) |
117.27 |
116.74 - 119.33 |
1.2275 times |
Tue 14 October 2025 |
116.70 (1.07%) |
113.54 |
113.41 - 116.96 |
1.2211 times |
Mon 13 October 2025 |
115.47 (1.29%) |
114.77 |
113.78 - 115.77 |
0.6757 times |
Fri 10 October 2025 |
114.00 (-1.63%) |
116.06 |
112.99 - 116.21 |
0.9765 times |
Thu 09 October 2025 |
115.89 (-0.03%) |
115.79 |
114.84 - 116.58 |
0.9468 times |
Wed 08 October 2025 |
115.92 (1.22%) |
114.21 |
113.98 - 116.45 |
1.0474 times |
Tue 07 October 2025 |
114.52 (1.04%) |
114.09 |
113.26 - 114.54 |
1.0136 times |
Mon 06 October 2025 |
113.34 (-1.68%) |
115.60 |
112.98 - 116.87 |
1.2688 times |
Weekly price and charts McgrathRentcorp Strong weekly Stock price targets for McgrathRentcorp MGRC are 118.75 and 121.24 | Weekly Target 1 | 116.7 | | Weekly Target 2 | 118.3 | | Weekly Target 3 | 119.18666666667 | | Weekly Target 4 | 120.79 | | Weekly Target 5 | 121.68 |
Weekly price and volumes for Mcgrath Rentcorp
| Date |
Closing |
Open |
Range |
Volume |
Mon 20 October 2025 |
119.91 (0.81%) |
118.55 |
117.58 - 120.07 |
0.1575 times |
Fri 17 October 2025 |
118.95 (4.34%) |
114.77 |
113.41 - 120.61 |
1.0105 times |
Fri 10 October 2025 |
114.00 (-1.11%) |
115.60 |
112.98 - 116.87 |
1.02 times |
Fri 03 October 2025 |
115.28 (-2.7%) |
118.67 |
114.74 - 118.86 |
1.3721 times |
Fri 26 September 2025 |
118.48 (-1.9%) |
121.08 |
118.06 - 122.98 |
1.3361 times |
Fri 19 September 2025 |
120.77 (-1.26%) |
122.45 |
119.87 - 125.50 |
1.6894 times |
Fri 12 September 2025 |
122.31 (-2.68%) |
125.68 |
119.21 - 126.42 |
1.0932 times |
Fri 05 September 2025 |
125.68 (3.45%) |
120.46 |
119.53 - 127.68 |
1.0204 times |
Fri 29 August 2025 |
121.49 (0%) |
124.41 |
120.80 - 125.31 |
0.21 times |
Fri 29 August 2025 |
121.49 (-2.04%) |
123.59 |
120.80 - 125.67 |
1.0908 times |
Fri 22 August 2025 |
124.02 (3.73%) |
120.12 |
117.69 - 124.27 |
1.2775 times |
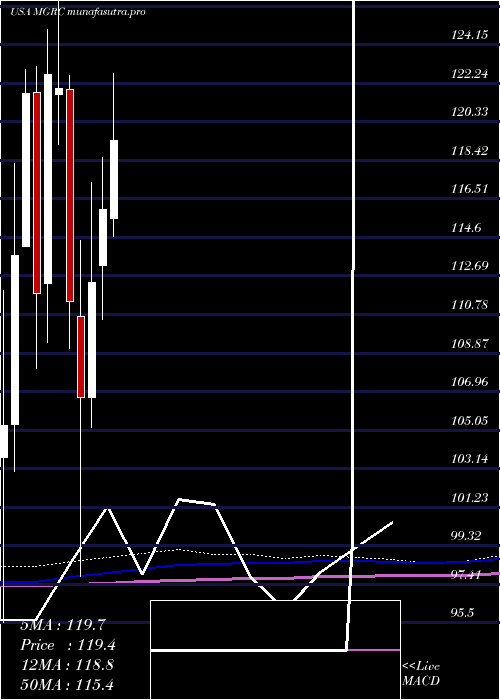
Monthly price and charts McgrathRentcorp Strong monthly Stock price targets for McgrathRentcorp MGRC are 116.45 and 124.08 | Monthly Target 1 | 110.2 | | Monthly Target 2 | 115.06 | | Monthly Target 3 | 117.83333333333 | | Monthly Target 4 | 122.69 | | Monthly Target 5 | 125.46 |
Monthly price and volumes Mcgrath Rentcorp
| Date |
Closing |
Open |
Range |
Volume |
Mon 20 October 2025 |
119.91 (2.23%) |
116.78 |
112.98 - 120.61 |
0.5368 times |
Tue 30 September 2025 |
117.30 (-3.45%) |
120.46 |
116.11 - 127.68 |
1.0176 times |
Fri 29 August 2025 |
121.49 (-2.64%) |
123.10 |
116.48 - 125.67 |
0.9015 times |
Thu 31 July 2025 |
124.79 (7.61%) |
115.53 |
112.26 - 128.41 |
0.9811 times |
Mon 30 June 2025 |
115.96 (3.19%) |
113.20 |
110.56 - 118.53 |
1.2416 times |
Fri 30 May 2025 |
112.38 (5.35%) |
106.66 |
105.20 - 117.32 |
0.9884 times |
Wed 30 April 2025 |
106.67 (-4.25%) |
110.70 |
97.81 - 114.43 |
1.1284 times |
Mon 31 March 2025 |
111.40 (-8.69%) |
121.91 |
109.09 - 122.63 |
1.0246 times |
Fri 28 February 2025 |
122.00 (-0.55%) |
121.66 |
119.18 - 129.93 |
1.1694 times |
Fri 31 January 2025 |
122.67 (9.7%) |
112.30 |
109.38 - 124.88 |
1.0105 times |
Tue 31 December 2024 |
111.82 (-8.15%) |
121.78 |
108.10 - 123.05 |
0.7252 times |
DMA SMA EMA moving averages of Mcgrath Rentcorp MGRC
DMA (daily moving average) of Mcgrath Rentcorp MGRC
| DMA period | DMA value | | 5 day DMA | 118.51 | | 12 day DMA | 116.41 | | 20 day DMA | 117.02 | | 35 day DMA | 119.59 | | 50 day DMA | 120.19 | | 100 day DMA | 118.78 | | 150 day DMA | 115.7 | | 200 day DMA | 116.52 | EMA (exponential moving average) of Mcgrath Rentcorp MGRC
| EMA period | EMA current | EMA prev | EMA prev2 | | 5 day EMA | 118.48 | 117.76 | 117.16 | | 12 day EMA | 117.6 | 117.18 | 116.86 | | 20 day EMA | 117.85 | 117.63 | 117.49 | | 35 day EMA | 118.55 | 118.47 | 118.44 | | 50 day EMA | 119.91 | 119.91 | 119.95 |
SMA (simple moving average) of Mcgrath Rentcorp MGRC
| SMA period | SMA current | SMA prev | SMA prev2 | | 5 day SMA | 118.51 | 117.62 | 116.63 | | 12 day SMA | 116.41 | 116.08 | 115.89 | | 20 day SMA | 117.02 | 117.06 | 117.15 | | 35 day SMA | 119.59 | 119.64 | 119.71 | | 50 day SMA | 120.19 | 120.17 | 120.15 | | 100 day SMA | 118.78 | 118.73 | 118.67 | | 150 day SMA | 115.7 | 115.66 | 115.59 | | 200 day SMA | 116.52 | 116.48 | 116.44 |
|
|
