MgmResorts MGM full analysis,charts,indicators,moving averages,SMA,DMA,EMA,ADX,MACD,RSIMgm Resorts MGM WideScreen charts, DMA,SMA,EMA technical analysis, forecast prediction, by indicators ADX,MACD,RSI,CCI USA stock exchange
operates under Consumer Services sector & deals in Hotels Resorts
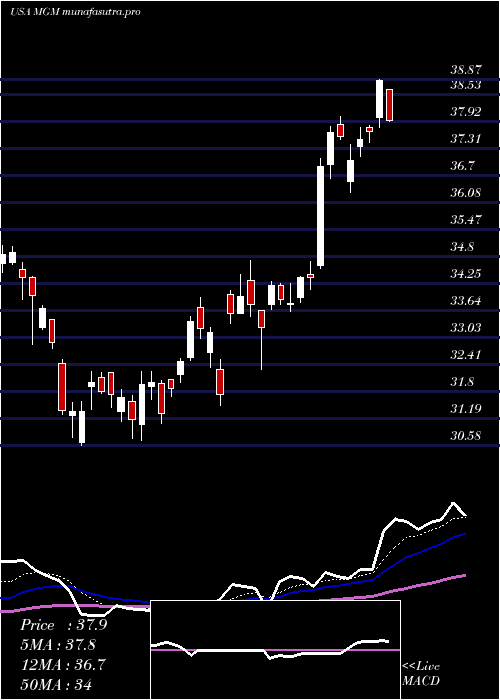
Daily price and charts and targets MgmResorts Strong Daily Stock price targets for MgmResorts MGM are 34.75 and 35.51 | Daily Target 1 | 34.54 | | Daily Target 2 | 34.96 | | Daily Target 3 | 35.296666666667 | | Daily Target 4 | 35.72 | | Daily Target 5 | 36.06 |
Daily price and volume Mgm Resorts
| Date |
Closing |
Open |
Range |
Volume |
Thu 04 December 2025 |
35.39 (-0.42%) |
35.62 |
34.87 - 35.63 |
0.793 times |
Wed 03 December 2025 |
35.54 (0.57%) |
35.40 |
35.29 - 35.95 |
0.5855 times |
Tue 02 December 2025 |
35.34 (-0.28%) |
35.48 |
34.86 - 35.67 |
0.8302 times |
Mon 01 December 2025 |
35.44 (0.43%) |
35.40 |
35.16 - 35.83 |
1.1105 times |
Fri 28 November 2025 |
35.29 (1.47%) |
34.87 |
34.87 - 35.62 |
0.4357 times |
Wed 26 November 2025 |
34.78 (1.87%) |
34.12 |
34.05 - 34.97 |
1.0152 times |
Tue 25 November 2025 |
34.14 (5.47%) |
32.53 |
32.52 - 34.41 |
1.524 times |
Mon 24 November 2025 |
32.37 (-0.55%) |
32.77 |
32.26 - 32.98 |
0.7195 times |
Fri 21 November 2025 |
32.55 (5.82%) |
30.82 |
30.60 - 32.84 |
1.9487 times |
Thu 20 November 2025 |
30.76 (-1.09%) |
31.31 |
30.68 - 32.02 |
1.0376 times |
Wed 19 November 2025 |
31.10 (-0.99%) |
31.50 |
30.91 - 31.50 |
0.968 times |
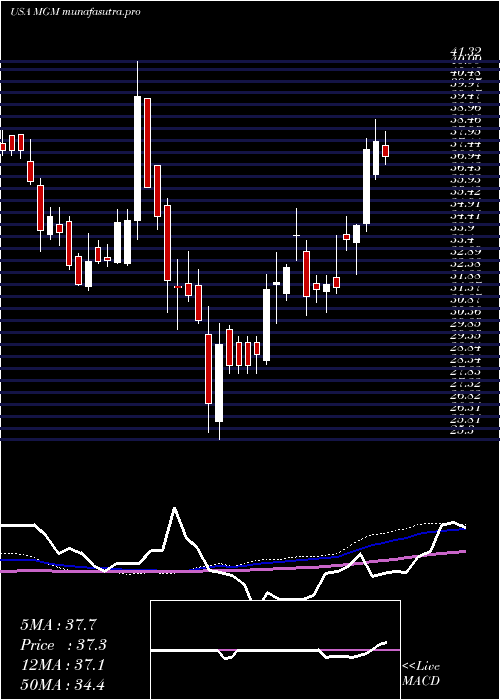
Weekly price and charts MgmResorts Strong weekly Stock price targets for MgmResorts MGM are 34.58 and 35.67 | Weekly Target 1 | 34.31 | | Weekly Target 2 | 34.85 | | Weekly Target 3 | 35.4 | | Weekly Target 4 | 35.94 | | Weekly Target 5 | 36.49 |
Weekly price and volumes for Mgm Resorts
| Date |
Closing |
Open |
Range |
Volume |
Thu 04 December 2025 |
35.39 (0.28%) |
35.40 |
34.86 - 35.95 |
0.6975 times |
Fri 28 November 2025 |
35.29 (8.42%) |
32.77 |
32.26 - 35.62 |
0.7763 times |
Fri 21 November 2025 |
32.55 (0.25%) |
32.04 |
30.55 - 32.84 |
1.3978 times |
Fri 14 November 2025 |
32.47 (-0.58%) |
32.89 |
32.13 - 33.55 |
0.9625 times |
Fri 07 November 2025 |
32.66 (1.97%) |
31.71 |
31.00 - 33.02 |
0.9171 times |
Fri 31 October 2025 |
32.03 (0%) |
30.67 |
30.52 - 32.07 |
0.4528 times |
Fri 31 October 2025 |
32.03 (-2.38%) |
33.20 |
29.19 - 33.35 |
1.8946 times |
Fri 24 October 2025 |
32.81 (3.96%) |
31.90 |
31.76 - 33.58 |
0.7291 times |
Fri 17 October 2025 |
31.56 (0.9%) |
31.68 |
31.23 - 33.70 |
0.9413 times |
Fri 10 October 2025 |
31.28 (-8.14%) |
34.05 |
31.26 - 34.38 |
1.2311 times |
Fri 03 October 2025 |
34.05 (-4.35%) |
36.02 |
33.59 - 36.84 |
1.1976 times |
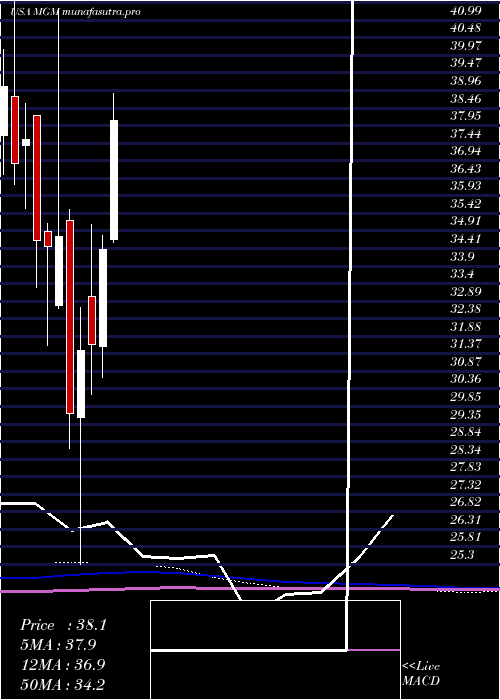
Monthly price and charts MgmResorts Strong monthly Stock price targets for MgmResorts MGM are 34.58 and 35.67 | Monthly Target 1 | 34.31 | | Monthly Target 2 | 34.85 | | Monthly Target 3 | 35.4 | | Monthly Target 4 | 35.94 | | Monthly Target 5 | 36.49 |
Monthly price and volumes Mgm Resorts
| Date |
Closing |
Open |
Range |
Volume |
Thu 04 December 2025 |
35.39 (0.28%) |
35.40 |
34.86 - 35.95 |
0.1479 times |
Fri 28 November 2025 |
35.29 (10.18%) |
31.71 |
30.55 - 35.62 |
0.8596 times |
Fri 31 October 2025 |
32.03 (-7.59%) |
34.30 |
29.19 - 35.55 |
1.2507 times |
Tue 30 September 2025 |
34.66 (-12.67%) |
39.12 |
34.10 - 39.14 |
1.0418 times |
Fri 29 August 2025 |
39.69 (8.89%) |
36.14 |
33.85 - 40.16 |
0.8681 times |
Thu 31 July 2025 |
36.45 (5.99%) |
34.66 |
34.59 - 39.29 |
1.1364 times |
Mon 30 June 2025 |
34.39 (8.66%) |
31.57 |
30.68 - 34.77 |
0.9427 times |
Fri 30 May 2025 |
31.65 (0.6%) |
33.04 |
30.21 - 35.11 |
1.1838 times |
Wed 30 April 2025 |
31.46 (6.14%) |
29.54 |
25.30 - 32.72 |
1.3864 times |
Mon 31 March 2025 |
29.64 (-14.73%) |
35.21 |
28.63 - 35.53 |
1.1826 times |
Fri 28 February 2025 |
34.76 (0.81%) |
32.76 |
32.67 - 41.32 |
1.0764 times |
DMA SMA EMA moving averages of Mgm Resorts MGM
DMA (daily moving average) of Mgm Resorts MGM
| DMA period | DMA value | | 5 day DMA | 35.4 | | 12 day DMA | 33.68 | | 20 day DMA | 33.2 | | 35 day DMA | 32.72 | | 50 day DMA | 32.98 | | 100 day DMA | 34.83 | | 150 day DMA | 34.48 | | 200 day DMA | 33.7 | EMA (exponential moving average) of Mgm Resorts MGM
| EMA period | EMA current | EMA prev | EMA prev2 | | 5 day EMA | 35.15 | 35.03 | 34.77 | | 12 day EMA | 34.25 | 34.04 | 33.77 | | 20 day EMA | 33.69 | 33.51 | 33.3 | | 35 day EMA | 33.46 | 33.35 | 33.22 | | 50 day EMA | 33.39 | 33.31 | 33.22 |
SMA (simple moving average) of Mgm Resorts MGM
| SMA period | SMA current | SMA prev | SMA prev2 | | 5 day SMA | 35.4 | 35.28 | 35 | | 12 day SMA | 33.68 | 33.34 | 33.09 | | 20 day SMA | 33.2 | 33.03 | 32.85 | | 35 day SMA | 32.72 | 32.63 | 32.54 | | 50 day SMA | 32.98 | 32.96 | 32.95 | | 100 day SMA | 34.83 | 34.86 | 34.88 | | 150 day SMA | 34.48 | 34.45 | 34.42 | | 200 day SMA | 33.7 | 33.71 | 33.73 |
|
|
