MagicSoftware MGIC full analysis,charts,indicators,moving averages,SMA,DMA,EMA,ADX,MACD,RSIMagic Software MGIC WideScreen charts, DMA,SMA,EMA technical analysis, forecast prediction, by indicators ADX,MACD,RSI,CCI USA stock exchange
operates under Technology sector & deals in Computer Software Prepackaged Software
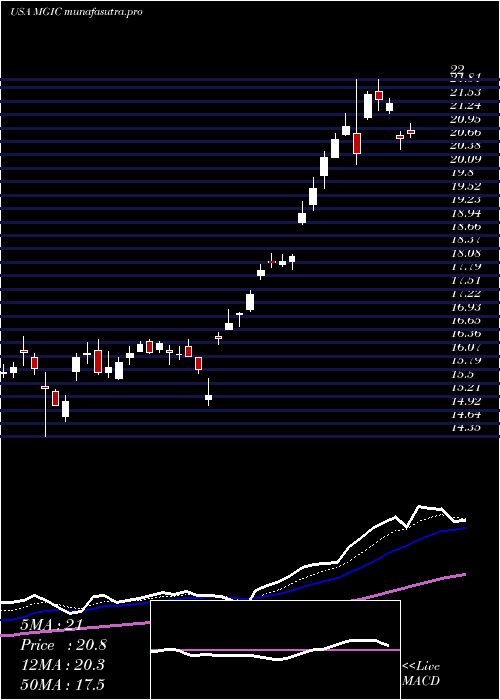
Daily price and charts and targets MagicSoftware Strong Daily Stock price targets for MagicSoftware MGIC are 25.07 and 25.42 | Daily Target 1 | 24.78 | | Daily Target 2 | 25.01 | | Daily Target 3 | 25.133333333333 | | Daily Target 4 | 25.36 | | Daily Target 5 | 25.48 |
Daily price and volume Magic Software
| Date |
Closing |
Open |
Range |
Volume |
Thu 04 December 2025 |
25.23 (2.64%) |
25.00 |
24.91 - 25.26 |
1.2008 times |
Wed 03 December 2025 |
24.58 (-1.32%) |
24.82 |
24.15 - 25.00 |
0.7911 times |
Tue 02 December 2025 |
24.91 (1.76%) |
25.08 |
24.50 - 25.65 |
1.2526 times |
Mon 01 December 2025 |
24.48 (6.07%) |
24.19 |
23.90 - 24.81 |
1.7542 times |
Fri 28 November 2025 |
23.08 (1.81%) |
22.86 |
22.75 - 23.21 |
0.3767 times |
Wed 26 November 2025 |
22.67 (-0.18%) |
22.72 |
22.46 - 22.95 |
0.704 times |
Tue 25 November 2025 |
22.71 (-2.62%) |
23.00 |
22.38 - 23.17 |
0.9489 times |
Mon 24 November 2025 |
23.32 (4.95%) |
22.88 |
22.48 - 23.43 |
1.2291 times |
Fri 21 November 2025 |
22.22 (1.69%) |
21.84 |
21.48 - 22.24 |
0.8971 times |
Thu 20 November 2025 |
21.85 (-3.49%) |
22.97 |
21.76 - 23.06 |
0.8453 times |
Wed 19 November 2025 |
22.64 (-1.82%) |
22.93 |
22.38 - 23.28 |
1.3327 times |
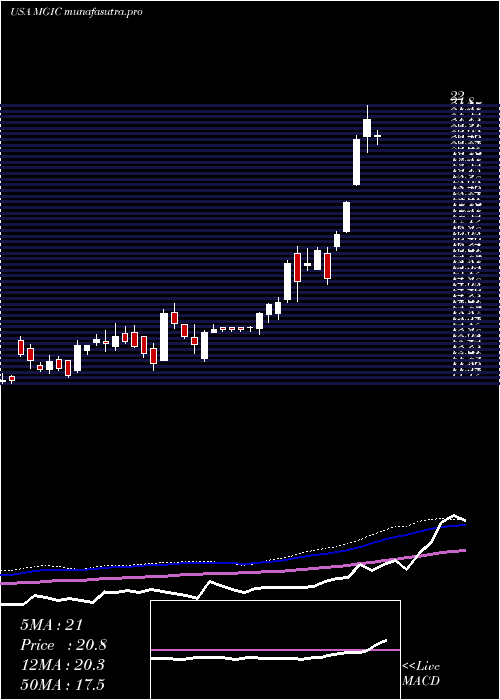
Weekly price and charts MagicSoftware Strong weekly Stock price targets for MagicSoftware MGIC are 24.57 and 26.32 | Weekly Target 1 | 23.18 | | Weekly Target 2 | 24.2 | | Weekly Target 3 | 24.926666666667 | | Weekly Target 4 | 25.95 | | Weekly Target 5 | 26.68 |
Weekly price and volumes for Magic Software
| Date |
Closing |
Open |
Range |
Volume |
Thu 04 December 2025 |
25.23 (9.32%) |
24.19 |
23.90 - 25.65 |
1.4746 times |
Fri 28 November 2025 |
23.08 (3.87%) |
22.88 |
22.38 - 23.43 |
0.9613 times |
Fri 21 November 2025 |
22.22 (-7.38%) |
24.28 |
21.48 - 24.90 |
1.4434 times |
Fri 14 November 2025 |
23.99 (9.29%) |
22.00 |
21.81 - 24.94 |
1.6858 times |
Fri 07 November 2025 |
21.95 (6.14%) |
21.43 |
20.94 - 21.98 |
0.9377 times |
Fri 31 October 2025 |
20.68 (0%) |
20.55 |
20.43 - 20.99 |
0.0528 times |
Fri 31 October 2025 |
20.68 (2.17%) |
20.71 |
20.43 - 21.09 |
0.8023 times |
Fri 24 October 2025 |
20.24 (-1.84%) |
20.45 |
19.38 - 20.52 |
0.8814 times |
Fri 17 October 2025 |
20.62 (0.78%) |
21.17 |
20.03 - 21.24 |
0.7897 times |
Fri 10 October 2025 |
20.46 (-1.06%) |
20.75 |
20.05 - 21.47 |
0.971 times |
Fri 03 October 2025 |
20.68 (7.43%) |
19.50 |
19.41 - 20.98 |
1.1178 times |
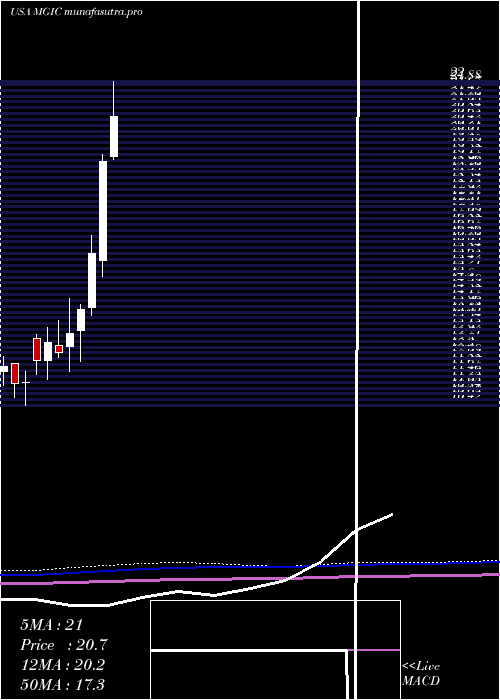
Monthly price and charts MagicSoftware Strong monthly Stock price targets for MagicSoftware MGIC are 24.57 and 26.32 | Monthly Target 1 | 23.18 | | Monthly Target 2 | 24.2 | | Monthly Target 3 | 24.926666666667 | | Monthly Target 4 | 25.95 | | Monthly Target 5 | 26.68 |
Monthly price and volumes Magic Software
| Date |
Closing |
Open |
Range |
Volume |
Thu 04 December 2025 |
25.23 (9.32%) |
24.19 |
23.90 - 25.65 |
0.1933 times |
Fri 28 November 2025 |
23.08 (11.61%) |
21.43 |
20.94 - 24.94 |
0.6591 times |
Fri 31 October 2025 |
20.68 (1.32%) |
20.40 |
19.38 - 21.47 |
0.5428 times |
Tue 30 September 2025 |
20.41 (0.54%) |
19.56 |
18.72 - 20.85 |
0.8369 times |
Fri 29 August 2025 |
20.30 (-1.98%) |
20.37 |
18.57 - 21.01 |
0.8664 times |
Thu 31 July 2025 |
20.71 (8.32%) |
19.31 |
19.20 - 22.00 |
1.5159 times |
Mon 30 June 2025 |
19.12 (20.78%) |
15.60 |
15.02 - 19.38 |
0.9725 times |
Fri 30 May 2025 |
15.83 (14.38%) |
13.90 |
13.64 - 16.50 |
1.1468 times |
Wed 30 April 2025 |
13.84 (6.54%) |
13.10 |
11.98 - 14.03 |
0.899 times |
Mon 31 March 2025 |
12.99 (5.61%) |
12.51 |
11.65 - 14.24 |
2.3674 times |
Fri 28 February 2025 |
12.30 (-3%) |
12.58 |
12.14 - 13.46 |
0.6399 times |
DMA SMA EMA moving averages of Magic Software MGIC
DMA (daily moving average) of Magic Software MGIC
| DMA period | DMA value | | 5 day DMA | 24.46 | | 12 day DMA | 23.4 | | 20 day DMA | 23.27 | | 35 day DMA | 22.09 | | 50 day DMA | 21.58 | | 100 day DMA | 20.93 | | 150 day DMA | 19.58 | | 200 day DMA | 17.96 | EMA (exponential moving average) of Magic Software MGIC
| EMA period | EMA current | EMA prev | EMA prev2 | | 5 day EMA | 24.5 | 24.13 | 23.9 | | 12 day EMA | 23.76 | 23.49 | 23.29 | | 20 day EMA | 23.22 | 23.01 | 22.85 | | 35 day EMA | 22.47 | 22.31 | 22.18 | | 50 day EMA | 21.71 | 21.57 | 21.45 |
SMA (simple moving average) of Magic Software MGIC
| SMA period | SMA current | SMA prev | SMA prev2 | | 5 day SMA | 24.46 | 23.94 | 23.57 | | 12 day SMA | 23.4 | 23.3 | 23.25 | | 20 day SMA | 23.27 | 23.08 | 22.9 | | 35 day SMA | 22.09 | 21.96 | 21.86 | | 50 day SMA | 21.58 | 21.46 | 21.36 | | 100 day SMA | 20.93 | 20.88 | 20.84 | | 150 day SMA | 19.58 | 19.5 | 19.43 | | 200 day SMA | 17.96 | 17.9 | 17.84 |
|
|
