MagnaInternational MGA full analysis,charts,indicators,moving averages,SMA,DMA,EMA,ADX,MACD,RSIMagna International MGA WideScreen charts, DMA,SMA,EMA technical analysis, forecast prediction, by indicators ADX,MACD,RSI,CCI USA stock exchange
operates under Capital Goods sector & deals in Auto Parts O E M
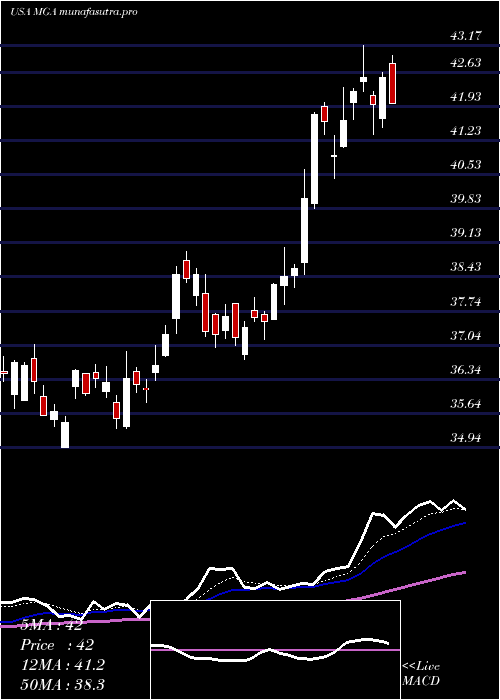
Daily price and charts and targets MagnaInternational Strong Daily Stock price targets for MagnaInternational MGA are 48.45 and 49.39 | Daily Target 1 | 48.28 | | Daily Target 2 | 48.62 | | Daily Target 3 | 49.223333333333 | | Daily Target 4 | 49.56 | | Daily Target 5 | 50.16 |
Daily price and volume Magna International
| Date |
Closing |
Open |
Range |
Volume |
Thu 04 December 2025 |
48.95 (-1.11%) |
49.65 |
48.89 - 49.83 |
0.7264 times |
Wed 03 December 2025 |
49.50 (0.36%) |
49.34 |
49.32 - 49.79 |
0.7991 times |
Tue 02 December 2025 |
49.32 (0.06%) |
50.00 |
48.85 - 50.00 |
0.3779 times |
Mon 01 December 2025 |
49.29 (0.92%) |
48.84 |
48.56 - 49.99 |
1.512 times |
Fri 28 November 2025 |
48.84 (0.02%) |
48.78 |
48.63 - 49.26 |
0.3928 times |
Wed 26 November 2025 |
48.83 (-0.73%) |
49.16 |
48.81 - 49.53 |
0.7875 times |
Tue 25 November 2025 |
49.19 (1.82%) |
48.69 |
48.51 - 49.77 |
1.4867 times |
Mon 24 November 2025 |
48.31 (0.1%) |
48.50 |
47.82 - 48.63 |
1.1038 times |
Fri 21 November 2025 |
48.26 (5.72%) |
46.40 |
46.37 - 48.36 |
1.5212 times |
Thu 20 November 2025 |
45.65 (-3.87%) |
47.68 |
45.33 - 48.04 |
1.2927 times |
Wed 19 November 2025 |
47.49 (-0.34%) |
48.00 |
47.27 - 48.00 |
0.7492 times |
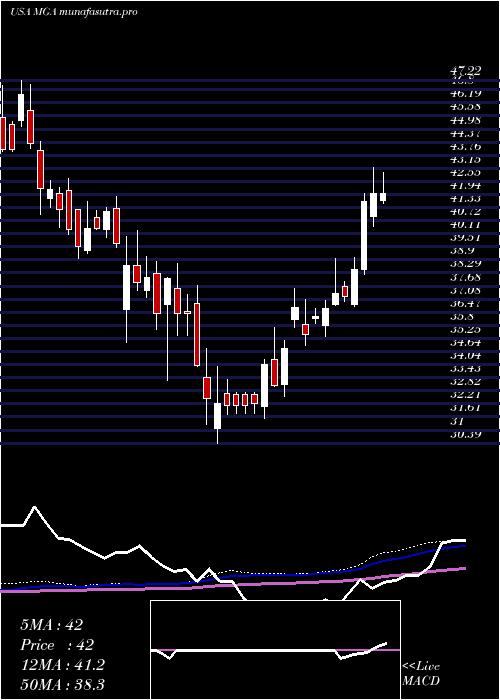
Weekly price and charts MagnaInternational Strong weekly Stock price targets for MagnaInternational MGA are 48.76 and 50.2 | Weekly Target 1 | 47.73 | | Weekly Target 2 | 48.34 | | Weekly Target 3 | 49.17 | | Weekly Target 4 | 49.78 | | Weekly Target 5 | 50.61 |
Weekly price and volumes for Magna International
| Date |
Closing |
Open |
Range |
Volume |
Thu 04 December 2025 |
48.95 (0.23%) |
48.84 |
48.56 - 50.00 |
0.763 times |
Fri 28 November 2025 |
48.84 (1.2%) |
48.50 |
47.82 - 49.77 |
0.8424 times |
Fri 21 November 2025 |
48.26 (-1.69%) |
48.89 |
45.33 - 49.18 |
1.4261 times |
Fri 14 November 2025 |
49.09 (-1.54%) |
49.95 |
48.34 - 50.77 |
1.3422 times |
Fri 07 November 2025 |
49.86 (5.61%) |
48.48 |
48.20 - 50.35 |
1.0397 times |
Fri 31 October 2025 |
47.21 (0%) |
46.01 |
45.59 - 47.87 |
0.5435 times |
Fri 31 October 2025 |
47.21 (2.16%) |
46.43 |
44.64 - 47.87 |
1.3685 times |
Fri 24 October 2025 |
46.21 (3.22%) |
45.32 |
44.68 - 46.69 |
1.0685 times |
Fri 17 October 2025 |
44.77 (-3.82%) |
44.12 |
43.11 - 45.33 |
0.9697 times |
Tue 07 October 2025 |
46.55 (-5%) |
49.32 |
46.44 - 49.80 |
0.6365 times |
Fri 03 October 2025 |
49.00 (5.11%) |
46.84 |
46.36 - 49.00 |
1.1996 times |
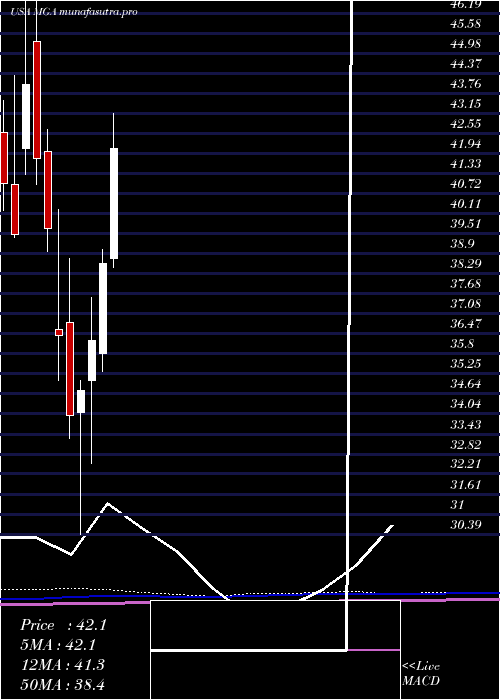
Monthly price and charts MagnaInternational Strong monthly Stock price targets for MagnaInternational MGA are 48.76 and 50.2 | Monthly Target 1 | 47.73 | | Monthly Target 2 | 48.34 | | Monthly Target 3 | 49.17 | | Monthly Target 4 | 49.78 | | Monthly Target 5 | 50.61 |
Monthly price and volumes Magna International
| Date |
Closing |
Open |
Range |
Volume |
Thu 04 December 2025 |
48.95 (0.23%) |
48.84 |
48.56 - 50.00 |
0.1497 times |
Fri 28 November 2025 |
48.84 (3.45%) |
48.48 |
45.33 - 50.77 |
0.9122 times |
Fri 31 October 2025 |
47.21 (-0.36%) |
47.35 |
43.11 - 49.80 |
1.0335 times |
Tue 30 September 2025 |
47.38 (3.22%) |
45.13 |
44.83 - 47.79 |
1.145 times |
Fri 29 August 2025 |
45.90 (11.95%) |
42.51 |
40.75 - 46.75 |
0.8473 times |
Thu 31 July 2025 |
41.00 (6.19%) |
38.74 |
38.49 - 43.64 |
0.9287 times |
Mon 30 June 2025 |
38.61 (6.42%) |
35.86 |
35.34 - 39.03 |
0.8358 times |
Fri 30 May 2025 |
36.28 (4.37%) |
35.05 |
32.54 - 37.58 |
1.5839 times |
Wed 30 April 2025 |
34.76 (2.27%) |
34.07 |
30.39 - 35.06 |
1.3878 times |
Mon 31 March 2025 |
33.99 (-6.7%) |
36.82 |
33.28 - 38.75 |
1.176 times |
Fri 28 February 2025 |
36.43 (-8.17%) |
36.60 |
35.05 - 40.26 |
1.4145 times |
DMA SMA EMA moving averages of Magna International MGA
DMA (daily moving average) of Magna International MGA
| DMA period | DMA value | | 5 day DMA | 49.18 | | 12 day DMA | 48.44 | | 20 day DMA | 48.83 | | 35 day DMA | 47.7 | | 50 day DMA | 47.4 | | 100 day DMA | 45.78 | | 150 day DMA | 42.86 | | 200 day DMA | 40.96 | EMA (exponential moving average) of Magna International MGA
| EMA period | EMA current | EMA prev | EMA prev2 | | 5 day EMA | 49.09 | 49.16 | 48.99 | | 12 day EMA | 48.81 | 48.78 | 48.65 | | 20 day EMA | 48.52 | 48.47 | 48.36 | | 35 day EMA | 48.07 | 48.02 | 47.93 | | 50 day EMA | 47.53 | 47.47 | 47.39 |
SMA (simple moving average) of Magna International MGA
| SMA period | SMA current | SMA prev | SMA prev2 | | 5 day SMA | 49.18 | 49.16 | 49.09 | | 12 day SMA | 48.44 | 48.34 | 48.31 | | 20 day SMA | 48.83 | 48.88 | 48.85 | | 35 day SMA | 47.7 | 47.58 | 47.45 | | 50 day SMA | 47.4 | 47.36 | 47.32 | | 100 day SMA | 45.78 | 45.72 | 45.64 | | 150 day SMA | 42.86 | 42.76 | 42.66 | | 200 day SMA | 40.96 | 40.91 | 40.86 |
|
|
