MistrasGroup MG full analysis,charts,indicators,moving averages,SMA,DMA,EMA,ADX,MACD,RSIMistras Group MG WideScreen charts, DMA,SMA,EMA technical analysis, forecast prediction, by indicators ADX,MACD,RSI,CCI USA stock exchange
operates under Consumer Services sector & deals in Military Government Technical
Daily price and charts and targets MistrasGroup Strong Daily Stock price targets for MistrasGroup MG are 11.69 and 11.87 | Daily Target 1 | 11.65 | | Daily Target 2 | 11.73 | | Daily Target 3 | 11.83 | | Daily Target 4 | 11.91 | | Daily Target 5 | 12.01 |
Daily price and volume Mistras Group
| Date |
Closing |
Open |
Range |
Volume |
Thu 04 December 2025 |
11.81 (-0.08%) |
11.82 |
11.75 - 11.93 |
0.7155 times |
Wed 03 December 2025 |
11.82 (1.03%) |
11.78 |
11.56 - 11.95 |
0.8931 times |
Tue 02 December 2025 |
11.70 (-2.5%) |
12.00 |
11.67 - 12.02 |
1.0168 times |
Mon 01 December 2025 |
12.00 (0.08%) |
11.93 |
11.78 - 12.09 |
1.197 times |
Fri 28 November 2025 |
11.99 (1.1%) |
11.82 |
11.70 - 12.05 |
0.6247 times |
Wed 26 November 2025 |
11.86 (0%) |
11.86 |
11.86 - 12.10 |
0.6268 times |
Tue 25 November 2025 |
11.86 (3.13%) |
11.65 |
11.40 - 11.89 |
0.8359 times |
Mon 24 November 2025 |
11.50 (-2.38%) |
11.70 |
11.47 - 11.92 |
1.3268 times |
Fri 21 November 2025 |
11.78 (5.46%) |
11.41 |
11.22 - 11.85 |
1.4405 times |
Thu 20 November 2025 |
11.17 (-4.45%) |
11.83 |
11.13 - 11.97 |
1.3228 times |
Wed 19 November 2025 |
11.69 (-1.35%) |
11.93 |
11.52 - 11.98 |
0.9993 times |
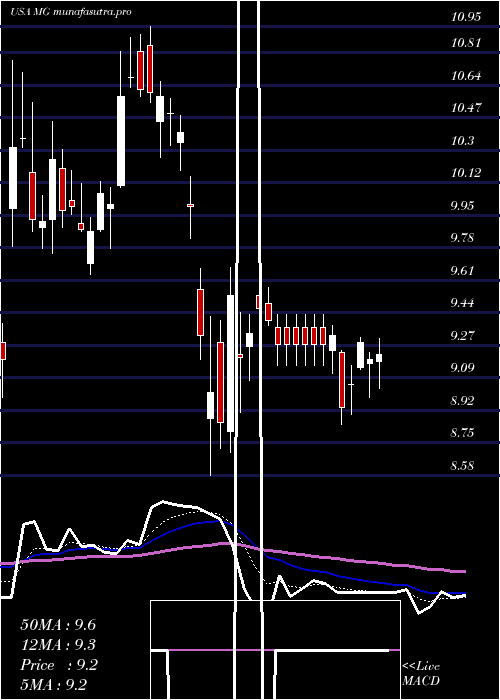
Weekly price and charts MistrasGroup Strong weekly Stock price targets for MistrasGroup MG are 11.42 and 11.95 | Weekly Target 1 | 11.29 | | Weekly Target 2 | 11.55 | | Weekly Target 3 | 11.82 | | Weekly Target 4 | 12.08 | | Weekly Target 5 | 12.35 |
Weekly price and volumes for Mistras Group
| Date |
Closing |
Open |
Range |
Volume |
Thu 04 December 2025 |
11.81 (-1.5%) |
11.93 |
11.56 - 12.09 |
1.0362 times |
Fri 28 November 2025 |
11.99 (1.78%) |
11.70 |
11.40 - 12.10 |
0.9256 times |
Fri 21 November 2025 |
11.78 (-5.38%) |
12.56 |
11.13 - 12.65 |
1.5463 times |
Fri 14 November 2025 |
12.45 (3.58%) |
12.13 |
12.05 - 13.43 |
2.2044 times |
Fri 07 November 2025 |
12.02 (26%) |
9.48 |
9.45 - 12.06 |
1.591 times |
Fri 31 October 2025 |
9.54 (0%) |
9.62 |
9.51 - 9.81 |
0.1566 times |
Fri 31 October 2025 |
9.54 (-4.89%) |
10.06 |
9.51 - 10.15 |
0.806 times |
Fri 24 October 2025 |
10.03 (5.58%) |
9.63 |
9.55 - 10.21 |
0.7405 times |
Fri 17 October 2025 |
9.50 (-1.66%) |
9.45 |
9.41 - 9.85 |
0.7427 times |
Tue 07 October 2025 |
9.66 (-1.13%) |
9.81 |
9.62 - 9.93 |
0.2507 times |
Fri 03 October 2025 |
9.77 (0.93%) |
9.75 |
9.65 - 10.51 |
1.3321 times |
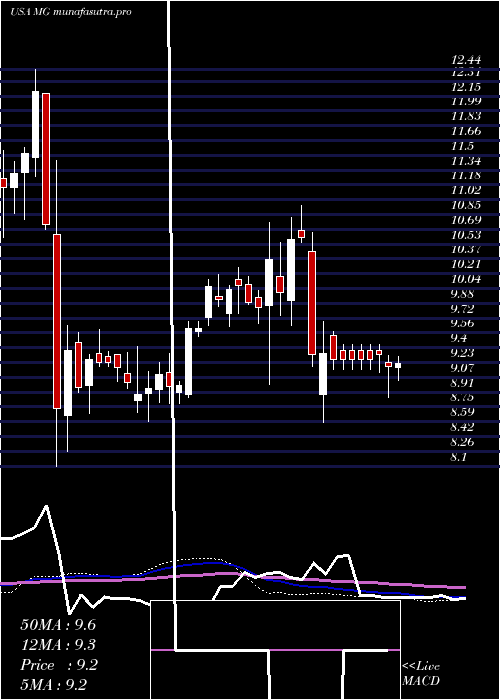
Monthly price and charts MistrasGroup Strong monthly Stock price targets for MistrasGroup MG are 11.42 and 11.95 | Monthly Target 1 | 11.29 | | Monthly Target 2 | 11.55 | | Monthly Target 3 | 11.82 | | Monthly Target 4 | 12.08 | | Monthly Target 5 | 12.35 |
Monthly price and volumes Mistras Group
| Date |
Closing |
Open |
Range |
Volume |
Thu 04 December 2025 |
11.81 (-1.5%) |
11.93 |
11.56 - 12.09 |
0.2118 times |
Fri 28 November 2025 |
11.99 (25.68%) |
9.48 |
9.45 - 13.43 |
1.2812 times |
Fri 31 October 2025 |
9.54 (-3.05%) |
9.89 |
9.41 - 10.51 |
0.6905 times |
Tue 30 September 2025 |
9.84 (2.93%) |
9.48 |
9.35 - 10.10 |
0.9532 times |
Fri 29 August 2025 |
9.56 (20.4%) |
7.84 |
7.74 - 9.99 |
0.988 times |
Thu 31 July 2025 |
7.94 (-0.87%) |
8.00 |
7.76 - 8.37 |
0.7638 times |
Mon 30 June 2025 |
8.01 (6.09%) |
7.53 |
7.38 - 8.05 |
1.3534 times |
Fri 30 May 2025 |
7.55 (-17.21%) |
9.20 |
7.06 - 9.70 |
1.2394 times |
Wed 30 April 2025 |
9.12 (-13.8%) |
10.49 |
8.58 - 10.57 |
1.0552 times |
Mon 31 March 2025 |
10.58 (7.52%) |
9.86 |
8.99 - 10.95 |
1.4635 times |
Fri 28 February 2025 |
9.84 (-0.81%) |
9.77 |
9.63 - 10.27 |
0.5592 times |

DMA SMA EMA moving averages of Mistras Group MG
DMA (daily moving average) of Mistras Group MG
| DMA period | DMA value | | 5 day DMA | 11.86 | | 12 day DMA | 11.75 | | 20 day DMA | 12.05 | | 35 day DMA | 11.11 | | 50 day DMA | 10.71 | | 100 day DMA | 9.81 | | 150 day DMA | 9.22 | | 200 day DMA | 9.35 | EMA (exponential moving average) of Mistras Group MG
| EMA period | EMA current | EMA prev | EMA prev2 | | 5 day EMA | 11.82 | 11.83 | 11.83 | | 12 day EMA | 11.79 | 11.79 | 11.79 | | 20 day EMA | 11.66 | 11.64 | 11.62 | | 35 day EMA | 11.29 | 11.26 | 11.23 | | 50 day EMA | 10.73 | 10.69 | 10.64 |
SMA (simple moving average) of Mistras Group MG
| SMA period | SMA current | SMA prev | SMA prev2 | | 5 day SMA | 11.86 | 11.87 | 11.88 | | 12 day SMA | 11.75 | 11.78 | 11.83 | | 20 day SMA | 12.05 | 12.05 | 11.94 | | 35 day SMA | 11.11 | 11.05 | 10.99 | | 50 day SMA | 10.71 | 10.66 | 10.62 | | 100 day SMA | 9.81 | 9.78 | 9.74 | | 150 day SMA | 9.22 | 9.2 | 9.18 | | 200 day SMA | 9.35 | 9.34 | 9.33 |
|
|
