MedpaceHoldings MEDP full analysis,charts,indicators,moving averages,SMA,DMA,EMA,ADX,MACD,RSIMedpace Holdings MEDP WideScreen charts, DMA,SMA,EMA technical analysis, forecast prediction, by indicators ADX,MACD,RSI,CCI USA stock exchange
operates under Health Care sector & deals in Biotechnology Commercial Physical Biological Resarch
Daily price and charts and targets MedpaceHoldings Strong Daily Stock price targets for MedpaceHoldings MEDP are 542.26 and 555.86 | Daily Target 1 | 531.24 | | Daily Target 2 | 539.68 | | Daily Target 3 | 544.84 | | Daily Target 4 | 553.28 | | Daily Target 5 | 558.44 |
Daily price and volume Medpace Holdings
| Date |
Closing |
Open |
Range |
Volume |
Fri 05 December 2025 |
548.12 (0.61%) |
547.53 |
536.40 - 550.00 |
1.0218 times |
Thu 04 December 2025 |
544.77 (-5.5%) |
574.09 |
530.96 - 576.29 |
1.6765 times |
Wed 03 December 2025 |
576.49 (-1.24%) |
584.59 |
571.30 - 592.15 |
0.7085 times |
Tue 02 December 2025 |
583.70 (-0.73%) |
590.00 |
582.74 - 592.91 |
0.9464 times |
Mon 01 December 2025 |
587.98 (-0.76%) |
588.81 |
586.58 - 596.51 |
0.8221 times |
Fri 28 November 2025 |
592.46 (-2.33%) |
601.11 |
585.65 - 604.48 |
0.5879 times |
Wed 26 November 2025 |
606.60 (-0.85%) |
610.51 |
601.07 - 612.85 |
0.8822 times |
Tue 25 November 2025 |
611.81 (-1.08%) |
616.70 |
610.51 - 626.26 |
1.0175 times |
Mon 24 November 2025 |
618.49 (4.51%) |
597.13 |
593.44 - 620.79 |
1.6057 times |
Fri 21 November 2025 |
591.82 (0.97%) |
587.00 |
579.27 - 596.38 |
0.7316 times |
Thu 20 November 2025 |
586.16 (-1.02%) |
600.00 |
583.49 - 605.00 |
0.3966 times |
Weekly price and charts MedpaceHoldings Strong weekly Stock price targets for MedpaceHoldings MEDP are 506.77 and 572.32 | Weekly Target 1 | 492.98 | | Weekly Target 2 | 520.55 | | Weekly Target 3 | 558.53 | | Weekly Target 4 | 586.1 | | Weekly Target 5 | 624.08 |
Weekly price and volumes for Medpace Holdings
| Date |
Closing |
Open |
Range |
Volume |
Fri 05 December 2025 |
548.12 (-7.48%) |
588.81 |
530.96 - 596.51 |
1.3487 times |
Fri 28 November 2025 |
592.46 (0.11%) |
597.13 |
585.65 - 626.26 |
1.0668 times |
Fri 21 November 2025 |
591.82 (0.29%) |
589.18 |
575.00 - 605.00 |
0.7434 times |
Fri 14 November 2025 |
590.09 (0.16%) |
595.00 |
583.79 - 609.13 |
0.9077 times |
Fri 07 November 2025 |
589.15 (0.72%) |
586.04 |
573.07 - 602.54 |
0.7593 times |
Fri 31 October 2025 |
584.91 (0%) |
580.37 |
572.50 - 588.54 |
0.1658 times |
Fri 31 October 2025 |
584.91 (-3.35%) |
606.59 |
571.03 - 614.04 |
1.1241 times |
Fri 24 October 2025 |
605.20 (14.61%) |
530.06 |
525.77 - 625.00 |
1.6544 times |
Fri 17 October 2025 |
528.07 (5.36%) |
507.69 |
497.33 - 529.78 |
1.2115 times |
Fri 10 October 2025 |
501.22 (-5.87%) |
536.99 |
494.17 - 538.32 |
1.0182 times |
Fri 03 October 2025 |
532.49 (7.19%) |
499.15 |
495.06 - 547.15 |
1.2651 times |

Monthly price and charts MedpaceHoldings Strong monthly Stock price targets for MedpaceHoldings MEDP are 506.77 and 572.32 | Monthly Target 1 | 492.98 | | Monthly Target 2 | 520.55 | | Monthly Target 3 | 558.53 | | Monthly Target 4 | 586.1 | | Monthly Target 5 | 624.08 |
Monthly price and volumes Medpace Holdings
| Date |
Closing |
Open |
Range |
Volume |
Fri 05 December 2025 |
548.12 (-7.48%) |
588.81 |
530.96 - 596.51 |
0.2229 times |
Fri 28 November 2025 |
592.46 (1.29%) |
586.04 |
573.07 - 626.26 |
0.5747 times |
Fri 31 October 2025 |
584.91 (13.76%) |
514.54 |
494.17 - 625.00 |
0.9955 times |
Tue 30 September 2025 |
514.16 (8.13%) |
474.41 |
462.06 - 514.90 |
0.793 times |
Fri 29 August 2025 |
475.51 (11.31%) |
424.21 |
412.35 - 477.48 |
0.9159 times |
Thu 31 July 2025 |
427.20 (36.11%) |
314.44 |
306.70 - 501.30 |
1.9603 times |
Mon 30 June 2025 |
313.86 (6.43%) |
293.87 |
291.28 - 318.42 |
1.021 times |
Fri 30 May 2025 |
294.90 (-4.37%) |
306.15 |
284.10 - 315.53 |
0.8851 times |
Wed 30 April 2025 |
308.39 (1.21%) |
305.85 |
250.05 - 311.99 |
1.7613 times |
Mon 31 March 2025 |
304.69 (-6.91%) |
327.50 |
289.01 - 348.00 |
0.8702 times |
Fri 28 February 2025 |
327.32 (-6.25%) |
343.55 |
321.92 - 375.00 |
0.9098 times |
DMA SMA EMA moving averages of Medpace Holdings MEDP
DMA (daily moving average) of Medpace Holdings MEDP
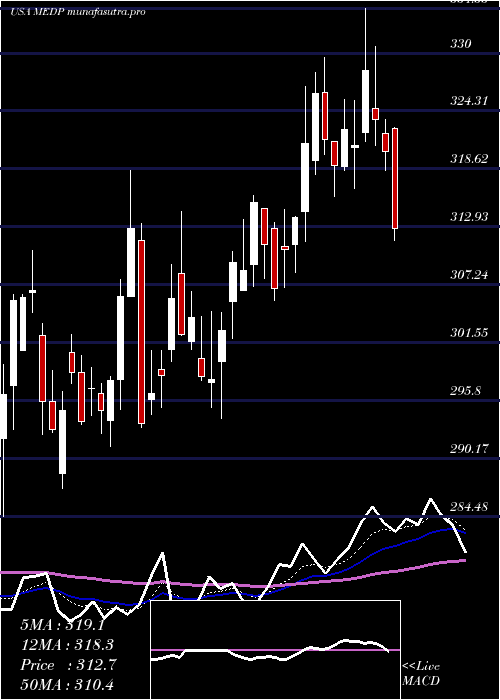
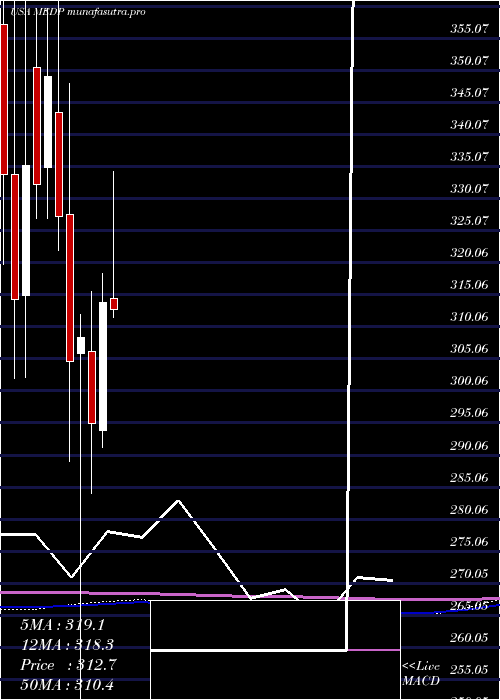
| DMA period | DMA value | | 5 day DMA | 568.21 | | 12 day DMA | 586.72 | | 20 day DMA | 589.39 | | 35 day DMA | 584.37 | | 50 day DMA | 565.4 | | 100 day DMA | 512.14 | | 150 day DMA | 443.5 | | 200 day DMA | 410.73 | EMA (exponential moving average) of Medpace Holdings MEDP
| EMA period | EMA current | EMA prev | EMA prev2 | | 5 day EMA | 564.63 | 572.88 | 586.94 | | 12 day EMA | 578.64 | 584.19 | 591.35 | | 20 day EMA | 581.27 | 584.76 | 588.97 | | 35 day EMA | 571.98 | 573.39 | 575.08 | | 50 day EMA | 559.8 | 560.28 | 560.91 |
SMA (simple moving average) of Medpace Holdings MEDP
| SMA period | SMA current | SMA prev | SMA prev2 | | 5 day SMA | 568.21 | 577.08 | 589.45 | | 12 day SMA | 586.72 | 590.22 | 593.64 | | 20 day SMA | 589.39 | 591.6 | 594.3 | | 35 day SMA | 584.37 | 583.6 | 582.73 | | 50 day SMA | 565.4 | 564.2 | 563.25 | | 100 day SMA | 512.14 | 509.8 | 507.48 | | 150 day SMA | 443.5 | 441.86 | 440.29 | | 200 day SMA | 410.73 | 409.71 | 408.69 |
|
|
