MondelezInternational MDLZ full analysis,charts,indicators,moving averages,SMA,DMA,EMA,ADX,MACD,RSIMondelez International MDLZ WideScreen charts, DMA,SMA,EMA technical analysis, forecast prediction, by indicators ADX,MACD,RSI,CCI USA stock exchange
operates under Consumer Non Durables sector & deals in Packaged Foods
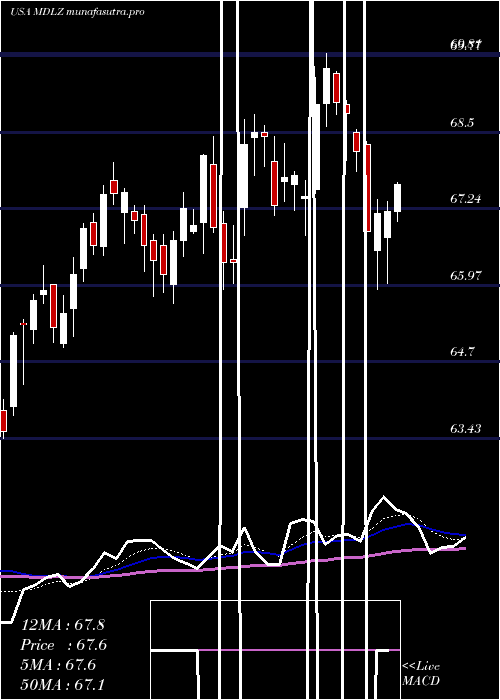
Daily price and charts and targets MondelezInternational Strong Daily Stock price targets for MondelezInternational MDLZ are 54.04 and 55.62 | Daily Target 1 | 53.75 | | Daily Target 2 | 54.33 | | Daily Target 3 | 55.33 | | Daily Target 4 | 55.91 | | Daily Target 5 | 56.91 |
Daily price and volume Mondelez International
| Date |
Closing |
Open |
Range |
Volume |
Fri 05 December 2025 |
54.91 (-1.58%) |
55.69 |
54.75 - 56.33 |
0.8831 times |
Thu 04 December 2025 |
55.79 (-0.43%) |
56.03 |
55.33 - 56.31 |
0.6675 times |
Wed 03 December 2025 |
56.03 (0.07%) |
55.97 |
55.65 - 56.69 |
1.2223 times |
Tue 02 December 2025 |
55.99 (-0.73%) |
56.30 |
55.39 - 56.49 |
0.5988 times |
Mon 01 December 2025 |
56.40 (-2.03%) |
57.20 |
56.06 - 57.35 |
1.5612 times |
Fri 28 November 2025 |
57.57 (0.63%) |
57.06 |
56.86 - 57.63 |
0.4429 times |
Wed 26 November 2025 |
57.21 (1.2%) |
56.58 |
56.37 - 57.42 |
0.8375 times |
Tue 25 November 2025 |
56.53 (0.61%) |
55.89 |
55.70 - 56.73 |
1.1057 times |
Mon 24 November 2025 |
56.19 (-1.42%) |
57.00 |
55.88 - 57.09 |
1.3194 times |
Fri 21 November 2025 |
57.00 (2.24%) |
55.73 |
55.45 - 57.09 |
1.3618 times |
Thu 20 November 2025 |
55.75 (-0.59%) |
55.98 |
55.19 - 56.56 |
1.1841 times |
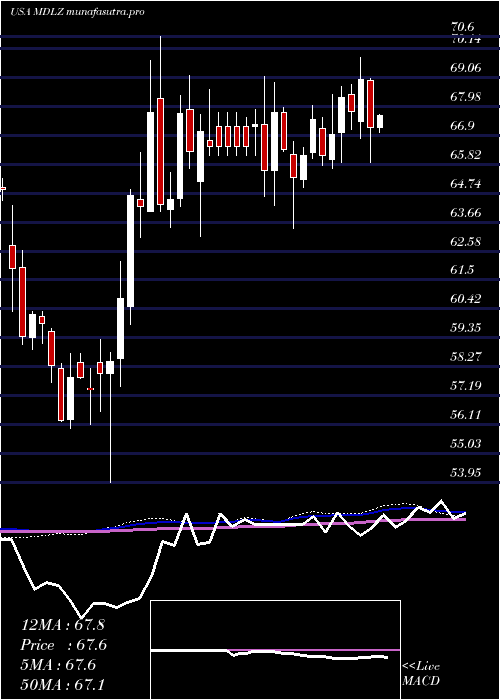
Weekly price and charts MondelezInternational Strong weekly Stock price targets for MondelezInternational MDLZ are 53.53 and 56.13 | Weekly Target 1 | 53.07 | | Weekly Target 2 | 53.99 | | Weekly Target 3 | 55.67 | | Weekly Target 4 | 56.59 | | Weekly Target 5 | 58.27 |
Weekly price and volumes for Mondelez International
| Date |
Closing |
Open |
Range |
Volume |
Fri 05 December 2025 |
54.91 (-4.62%) |
57.20 |
54.75 - 57.35 |
1.0725 times |
Fri 28 November 2025 |
57.57 (1%) |
57.00 |
55.70 - 57.63 |
0.8057 times |
Fri 21 November 2025 |
57.00 (0.25%) |
56.78 |
55.03 - 57.09 |
1.2665 times |
Fri 14 November 2025 |
56.86 (-0.56%) |
57.00 |
56.20 - 57.72 |
1.1266 times |
Fri 07 November 2025 |
57.18 (-0.49%) |
56.89 |
55.44 - 57.82 |
1.016 times |
Fri 31 October 2025 |
57.46 (0%) |
56.97 |
56.63 - 57.94 |
0.3504 times |
Fri 31 October 2025 |
57.46 (-5.45%) |
60.65 |
56.63 - 62.43 |
1.8244 times |
Fri 24 October 2025 |
60.77 (-2.71%) |
62.82 |
60.55 - 63.24 |
0.8184 times |
Fri 17 October 2025 |
62.46 (1.64%) |
60.79 |
60.41 - 62.74 |
0.8215 times |
Fri 10 October 2025 |
61.45 (-1.95%) |
62.71 |
60.87 - 63.24 |
0.898 times |
Fri 03 October 2025 |
62.67 (-1.09%) |
63.43 |
61.22 - 63.57 |
0.9078 times |
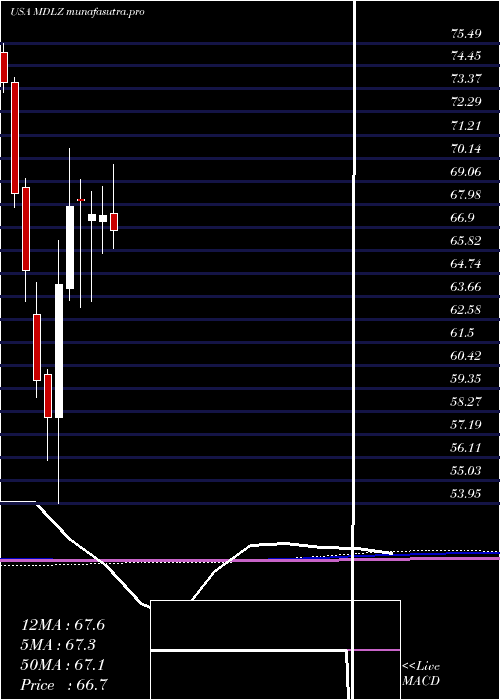
Monthly price and charts MondelezInternational Strong monthly Stock price targets for MondelezInternational MDLZ are 53.53 and 56.13 | Monthly Target 1 | 53.07 | | Monthly Target 2 | 53.99 | | Monthly Target 3 | 55.67 | | Monthly Target 4 | 56.59 | | Monthly Target 5 | 58.27 |
Monthly price and volumes Mondelez International
| Date |
Closing |
Open |
Range |
Volume |
Fri 05 December 2025 |
54.91 (-4.62%) |
57.20 |
54.75 - 57.35 |
0.265 times |
Fri 28 November 2025 |
57.57 (0.19%) |
56.89 |
55.03 - 57.82 |
1.0414 times |
Fri 31 October 2025 |
57.46 (-8.02%) |
62.55 |
56.63 - 63.38 |
1.2742 times |
Tue 30 September 2025 |
62.47 (1.68%) |
61.58 |
59.37 - 64.95 |
1.0257 times |
Fri 29 August 2025 |
61.44 (-5.02%) |
65.37 |
60.26 - 66.29 |
0.9757 times |
Thu 31 July 2025 |
64.69 (-4.08%) |
67.55 |
64.17 - 71.15 |
1.1212 times |
Mon 30 June 2025 |
67.44 (-0.07%) |
67.17 |
65.66 - 68.80 |
0.826 times |
Fri 30 May 2025 |
67.49 (-0.94%) |
67.21 |
63.43 - 68.58 |
0.9836 times |
Wed 30 April 2025 |
68.13 (0.41%) |
68.20 |
63.14 - 69.12 |
1.2507 times |
Mon 31 March 2025 |
67.85 (5.64%) |
64.04 |
63.48 - 70.60 |
1.2366 times |
Fri 28 February 2025 |
64.23 (10.76%) |
57.99 |
53.95 - 66.27 |
1.4734 times |
DMA SMA EMA moving averages of Mondelez International MDLZ
DMA (daily moving average) of Mondelez International MDLZ
| DMA period | DMA value | | 5 day DMA | 55.82 | | 12 day DMA | 56.29 | | 20 day DMA | 56.41 | | 35 day DMA | 57.71 | | 50 day DMA | 59.02 | | 100 day DMA | 61.41 | | 150 day DMA | 63.27 | | 200 day DMA | 63.98 | EMA (exponential moving average) of Mondelez International MDLZ
| EMA period | EMA current | EMA prev | EMA prev2 | | 5 day EMA | 55.74 | 56.16 | 56.35 | | 12 day EMA | 56.2 | 56.43 | 56.55 | | 20 day EMA | 56.66 | 56.84 | 56.95 | | 35 day EMA | 57.85 | 58.02 | 58.15 | | 50 day EMA | 59.07 | 59.24 | 59.38 |
SMA (simple moving average) of Mondelez International MDLZ
| SMA period | SMA current | SMA prev | SMA prev2 | | 5 day SMA | 55.82 | 56.36 | 56.64 | | 12 day SMA | 56.29 | 56.36 | 56.34 | | 20 day SMA | 56.41 | 56.47 | 56.49 | | 35 day SMA | 57.71 | 57.9 | 58.06 | | 50 day SMA | 59.02 | 59.17 | 59.34 | | 100 day SMA | 61.41 | 61.53 | 61.64 | | 150 day SMA | 63.27 | 63.36 | 63.44 | | 200 day SMA | 63.98 | 64.01 | 64.04 |
|
|
