MongodbInc MDB full analysis,charts,indicators,moving averages,SMA,DMA,EMA,ADX,MACD,RSIMongodb Inc MDB WideScreen charts, DMA,SMA,EMA technical analysis, forecast prediction, by indicators ADX,MACD,RSI,CCI USA stock exchange
operates under Technology sector & deals in Computer Software Prepackaged Software
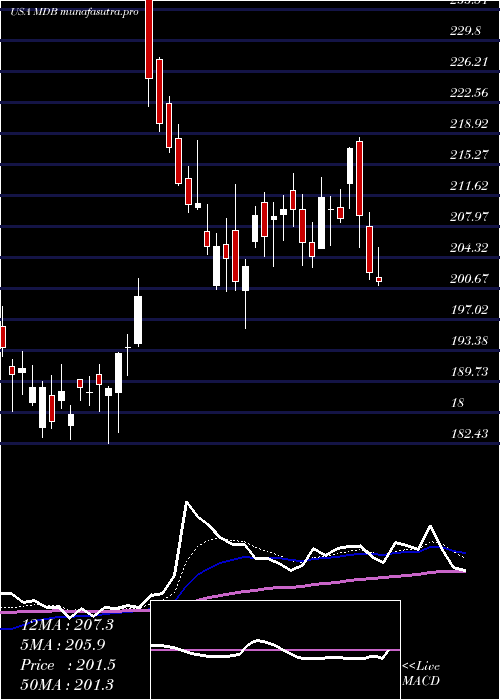
Daily price and charts and targets MongodbInc Strong Daily Stock price targets for MongodbInc MDB are 324.28 and 333.43 | Daily Target 1 | 317.13 | | Daily Target 2 | 322.27 | | Daily Target 3 | 326.28 | | Daily Target 4 | 331.42 | | Daily Target 5 | 335.43 |
Daily price and volume Mongodb Inc
| Date |
Closing |
Open |
Range |
Volume |
Mon 20 October 2025 |
327.41 (2.79%) |
321.39 |
321.14 - 330.29 |
0.8905 times |
Fri 17 October 2025 |
318.53 (1.33%) |
311.77 |
310.30 - 320.91 |
0.7929 times |
Thu 16 October 2025 |
314.35 (-1.09%) |
320.00 |
311.03 - 329.66 |
1.3061 times |
Wed 15 October 2025 |
317.83 (1.28%) |
315.94 |
314.00 - 319.98 |
0.7044 times |
Tue 14 October 2025 |
313.81 (-1.69%) |
312.32 |
307.21 - 317.91 |
0.7738 times |
Mon 13 October 2025 |
319.21 (1.52%) |
323.01 |
313.80 - 323.28 |
0.7044 times |
Fri 10 October 2025 |
314.44 (-5.14%) |
334.35 |
313.11 - 337.95 |
1.5584 times |
Thu 09 October 2025 |
331.48 (1.44%) |
329.50 |
325.00 - 335.53 |
1.1835 times |
Wed 08 October 2025 |
326.78 (2.61%) |
320.44 |
319.79 - 328.35 |
0.9643 times |
Tue 07 October 2025 |
318.46 (-1.08%) |
323.02 |
311.11 - 325.00 |
1.1217 times |
Mon 06 October 2025 |
321.93 (0.2%) |
323.22 |
319.72 - 331.51 |
1.3354 times |
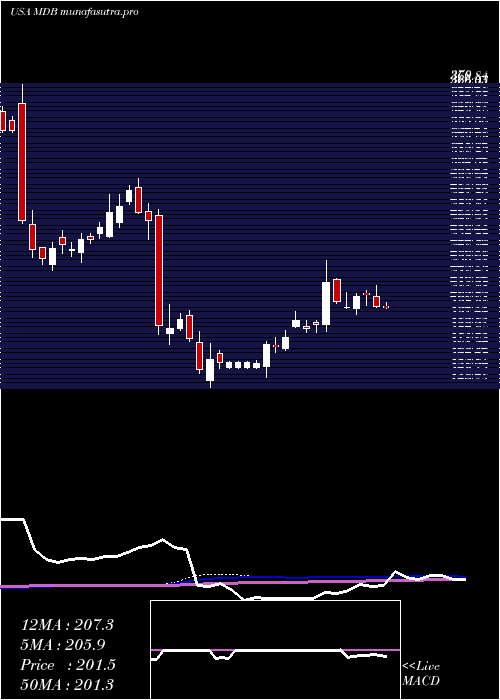
Weekly price and charts MongodbInc Strong weekly Stock price targets for MongodbInc MDB are 324.28 and 333.43 | Weekly Target 1 | 317.13 | | Weekly Target 2 | 322.27 | | Weekly Target 3 | 326.28 | | Weekly Target 4 | 331.42 | | Weekly Target 5 | 335.43 |
Weekly price and volumes for Mongodb Inc
| Date |
Closing |
Open |
Range |
Volume |
Mon 20 October 2025 |
327.41 (2.79%) |
321.39 |
321.14 - 330.29 |
0.0929 times |
Fri 17 October 2025 |
318.53 (1.3%) |
323.01 |
307.21 - 329.66 |
0.4465 times |
Fri 10 October 2025 |
314.44 (-2.13%) |
323.22 |
311.11 - 337.95 |
0.6427 times |
Fri 03 October 2025 |
321.28 (0.9%) |
321.00 |
306.43 - 335.83 |
0.821 times |
Fri 26 September 2025 |
318.41 (-1.55%) |
323.19 |
309.34 - 327.50 |
0.6496 times |
Fri 19 September 2025 |
323.43 (-2.02%) |
335.51 |
306.50 - 344.30 |
1.2311 times |
Fri 12 September 2025 |
330.10 (1.65%) |
326.25 |
320.65 - 344.85 |
0.7193 times |
Fri 05 September 2025 |
324.74 (2.89%) |
310.00 |
306.01 - 331.04 |
1.0155 times |
Fri 29 August 2025 |
315.61 (0%) |
314.42 |
308.39 - 321.92 |
0.4716 times |
Fri 29 August 2025 |
315.61 (44.07%) |
219.00 |
212.31 - 321.92 |
3.9098 times |
Fri 22 August 2025 |
219.06 (0.37%) |
222.98 |
206.92 - 231.55 |
0.8163 times |
Monthly price and charts MongodbInc Strong monthly Stock price targets for MongodbInc MDB are 317.31 and 348.05 | Monthly Target 1 | 293.45 | | Monthly Target 2 | 310.43 | | Monthly Target 3 | 324.19 | | Monthly Target 4 | 341.17 | | Monthly Target 5 | 354.93 |
Monthly price and volumes Mongodb Inc
| Date |
Closing |
Open |
Range |
Volume |
Mon 20 October 2025 |
327.41 (5.49%) |
310.75 |
307.21 - 337.95 |
0.4374 times |
Tue 30 September 2025 |
310.38 (-1.66%) |
310.00 |
306.01 - 344.85 |
0.9742 times |
Fri 29 August 2025 |
315.61 (32.67%) |
232.63 |
198.47 - 321.92 |
1.8559 times |
Thu 31 July 2025 |
237.89 (13.29%) |
210.00 |
201.01 - 251.24 |
0.9619 times |
Mon 30 June 2025 |
209.99 (11.21%) |
188.42 |
183.64 - 237.18 |
1.2107 times |
Fri 30 May 2025 |
188.83 (9.68%) |
178.20 |
169.26 - 198.58 |
0.9441 times |
Wed 30 April 2025 |
172.17 (-1.84%) |
174.69 |
140.78 - 183.00 |
1.0317 times |
Mon 31 March 2025 |
175.40 (-34.41%) |
270.63 |
170.85 - 275.54 |
1.3273 times |
Fri 28 February 2025 |
267.43 (-2.15%) |
266.00 |
253.00 - 298.92 |
0.5199 times |
Fri 31 January 2025 |
273.32 (17.4%) |
234.09 |
234.09 - 286.83 |
0.7368 times |
Tue 31 December 2024 |
232.81 (-30.59%) |
355.34 |
229.40 - 370.00 |
1.0894 times |
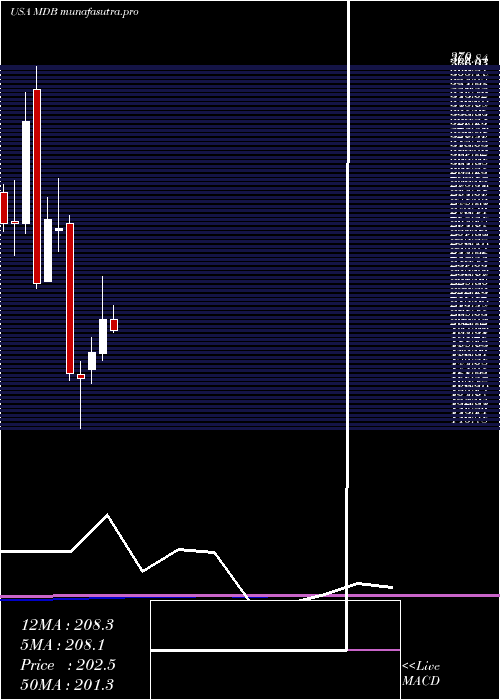
DMA SMA EMA moving averages of Mongodb Inc MDB
DMA (daily moving average) of Mongodb Inc MDB
| DMA period | DMA value | | 5 day DMA | 318.39 | | 12 day DMA | 320.46 | | 20 day DMA | 319.55 | | 35 day DMA | 321.72 | | 50 day DMA | 297.31 | | 100 day DMA | 255.51 | | 150 day DMA | 228.51 | | 200 day DMA | 235.34 | EMA (exponential moving average) of Mongodb Inc MDB
| EMA period | EMA current | EMA prev | EMA prev2 | | 5 day EMA | 320.81 | 317.51 | 317 | | 12 day EMA | 320.02 | 318.68 | 318.71 | | 20 day EMA | 317.86 | 316.86 | 316.68 | | 35 day EMA | 305.08 | 303.77 | 302.9 | | 50 day EMA | 293.15 | 291.75 | 290.66 |
SMA (simple moving average) of Mongodb Inc MDB
| SMA period | SMA current | SMA prev | SMA prev2 | | 5 day SMA | 318.39 | 316.75 | 315.93 | | 12 day SMA | 320.46 | 320.55 | 320.8 | | 20 day SMA | 319.55 | 319.35 | 319.6 | | 35 day SMA | 321.72 | 321.39 | 321.3 | | 50 day SMA | 297.31 | 294.78 | 292.59 | | 100 day SMA | 255.51 | 254.12 | 252.8 | | 150 day SMA | 228.51 | 227.56 | 226.67 | | 200 day SMA | 235.34 | 234.93 | 234.5 |
|
|
