MednaxInc MD full analysis,charts,indicators,moving averages,SMA,DMA,EMA,ADX,MACD,RSIMednax Inc MD WideScreen charts, DMA,SMA,EMA technical analysis, forecast prediction, by indicators ADX,MACD,RSI,CCI USA stock exchange
operates under Health Care sector & deals in Hospital Nursing Management
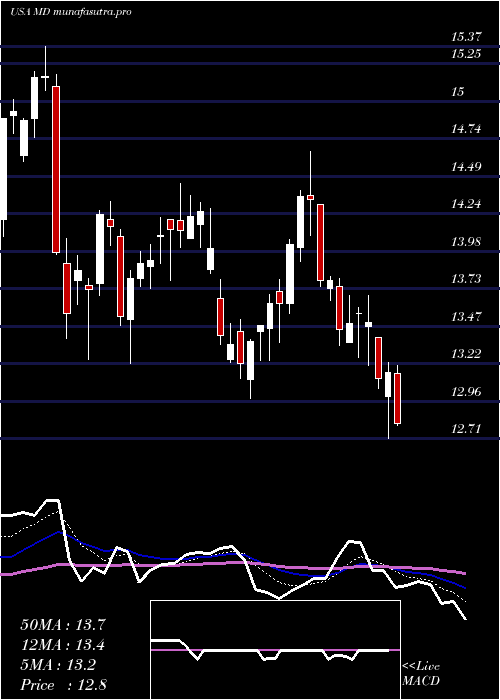
Daily price and charts and targets MednaxInc Strong Daily Stock price targets for MednaxInc MD are 21.61 and 22.83 | Daily Target 1 | 21.38 | | Daily Target 2 | 21.84 | | Daily Target 3 | 22.603333333333 | | Daily Target 4 | 23.06 | | Daily Target 5 | 23.82 |
Daily price and volume Mednax Inc
| Date |
Closing |
Open |
Range |
Volume |
Thu 04 December 2025 |
22.29 (-4.29%) |
23.22 |
22.15 - 23.37 |
1.3568 times |
Wed 03 December 2025 |
23.29 (-2.18%) |
23.81 |
23.15 - 24.01 |
0.7785 times |
Tue 02 December 2025 |
23.81 (-1.12%) |
24.12 |
23.57 - 24.39 |
0.81 times |
Mon 01 December 2025 |
24.08 (-0.04%) |
24.04 |
24.02 - 24.77 |
1.0033 times |
Fri 28 November 2025 |
24.09 (-1.47%) |
24.79 |
23.92 - 24.99 |
0.7089 times |
Wed 26 November 2025 |
24.45 (-0.81%) |
24.70 |
24.44 - 24.96 |
1.022 times |
Tue 25 November 2025 |
24.65 (3.44%) |
24.30 |
24.07 - 24.82 |
0.5999 times |
Mon 24 November 2025 |
23.83 (3.16%) |
23.41 |
23.11 - 24.02 |
1.4324 times |
Fri 21 November 2025 |
23.10 (1.58%) |
22.94 |
22.65 - 23.55 |
1.275 times |
Thu 20 November 2025 |
22.74 (-0.83%) |
23.09 |
22.66 - 24.00 |
1.0132 times |
Wed 19 November 2025 |
22.93 (-0.13%) |
23.23 |
22.81 - 23.43 |
0.712 times |
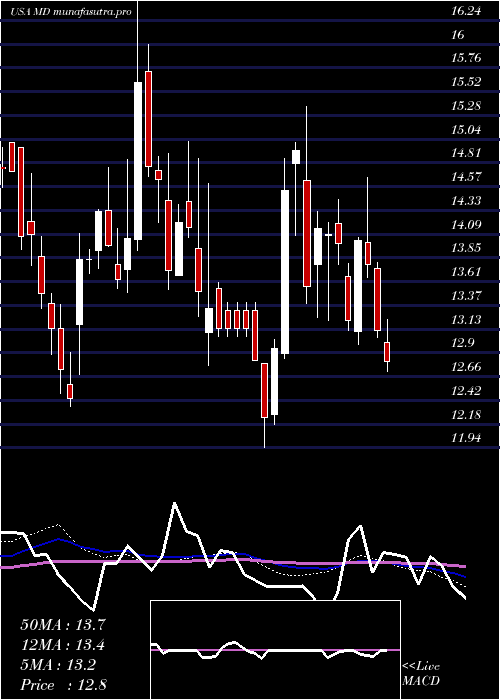
Weekly price and charts MednaxInc Strong weekly Stock price targets for MednaxInc MD are 20.91 and 23.53 | Weekly Target 1 | 20.45 | | Weekly Target 2 | 21.37 | | Weekly Target 3 | 23.07 | | Weekly Target 4 | 23.99 | | Weekly Target 5 | 25.69 |
Weekly price and volumes for Mednax Inc
| Date |
Closing |
Open |
Range |
Volume |
Thu 04 December 2025 |
22.29 (-7.47%) |
24.04 |
22.15 - 24.77 |
1.2081 times |
Fri 28 November 2025 |
24.09 (4.29%) |
23.41 |
23.11 - 24.99 |
1.1515 times |
Fri 21 November 2025 |
23.10 (-0.22%) |
22.98 |
22.65 - 24.00 |
1.6193 times |
Fri 14 November 2025 |
23.15 (5.56%) |
21.98 |
21.35 - 23.23 |
1.1467 times |
Fri 07 November 2025 |
21.93 (29.23%) |
21.08 |
20.87 - 22.38 |
1.5277 times |
Fri 31 October 2025 |
16.97 (0%) |
17.31 |
16.90 - 17.50 |
0.2508 times |
Fri 31 October 2025 |
16.97 (-3.58%) |
17.59 |
16.90 - 18.11 |
1.154 times |
Fri 24 October 2025 |
17.60 (6.99%) |
16.55 |
16.47 - 17.62 |
0.6879 times |
Fri 17 October 2025 |
16.45 (-6.53%) |
16.02 |
15.82 - 16.63 |
0.7969 times |
Tue 07 October 2025 |
17.60 (0.57%) |
17.79 |
17.33 - 18.22 |
0.4571 times |
Fri 03 October 2025 |
17.50 (7.36%) |
16.33 |
16.11 - 17.77 |
0.9373 times |
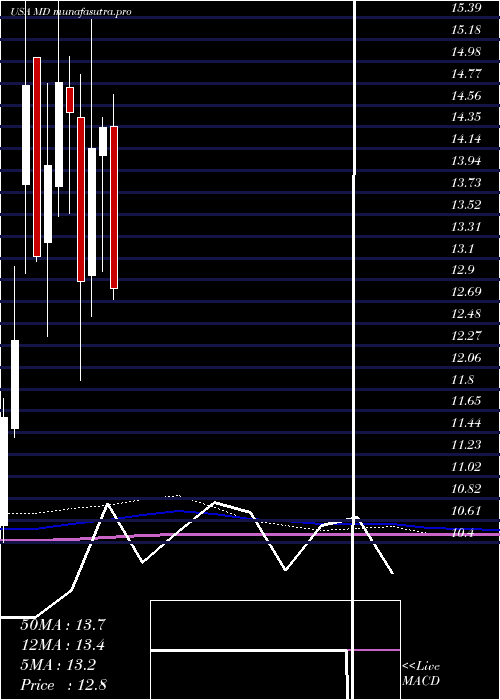
Monthly price and charts MednaxInc Strong monthly Stock price targets for MednaxInc MD are 20.91 and 23.53 | Monthly Target 1 | 20.45 | | Monthly Target 2 | 21.37 | | Monthly Target 3 | 23.07 | | Monthly Target 4 | 23.99 | | Monthly Target 5 | 25.69 |
Monthly price and volumes Mednax Inc
| Date |
Closing |
Open |
Range |
Volume |
Thu 04 December 2025 |
22.29 (-7.47%) |
24.04 |
22.15 - 24.77 |
0.3015 times |
Fri 28 November 2025 |
24.09 (41.96%) |
21.08 |
20.87 - 24.99 |
1.3591 times |
Fri 31 October 2025 |
16.97 (1.31%) |
16.64 |
15.82 - 18.22 |
0.988 times |
Tue 30 September 2025 |
16.75 (-2.67%) |
17.00 |
16.06 - 17.57 |
0.9804 times |
Fri 29 August 2025 |
17.21 (40.49%) |
12.14 |
11.84 - 17.28 |
1.2698 times |
Thu 31 July 2025 |
12.25 (-14.63%) |
14.36 |
12.16 - 14.66 |
0.8187 times |
Mon 30 June 2025 |
14.35 (1.41%) |
14.08 |
12.98 - 14.44 |
0.8618 times |
Fri 30 May 2025 |
14.15 (9.86%) |
12.94 |
12.55 - 15.37 |
1.7334 times |
Wed 30 April 2025 |
12.88 (-11.11%) |
14.44 |
11.94 - 14.85 |
0.7823 times |
Mon 31 March 2025 |
14.49 (-1.9%) |
14.73 |
13.53 - 15.02 |
0.9048 times |
Fri 28 February 2025 |
14.77 (5.65%) |
13.78 |
13.50 - 17.67 |
0.871 times |
DMA SMA EMA moving averages of Mednax Inc MD
DMA (daily moving average) of Mednax Inc MD
| DMA period | DMA value | | 5 day DMA | 23.51 | | 12 day DMA | 23.52 | | 20 day DMA | 23.13 | | 35 day DMA | 20.82 | | 50 day DMA | 19.58 | | 100 day DMA | 17.32 | | 150 day DMA | 16.17 | | 200 day DMA | 15.64 | EMA (exponential moving average) of Mednax Inc MD
| EMA period | EMA current | EMA prev | EMA prev2 | | 5 day EMA | 23.26 | 23.74 | 23.96 | | 12 day EMA | 23.23 | 23.4 | 23.42 | | 20 day EMA | 22.62 | 22.65 | 22.58 | | 35 day EMA | 21.3 | 21.24 | 21.12 | | 50 day EMA | 19.71 | 19.6 | 19.45 |
SMA (simple moving average) of Mednax Inc MD
| SMA period | SMA current | SMA prev | SMA prev2 | | 5 day SMA | 23.51 | 23.94 | 24.22 | | 12 day SMA | 23.52 | 23.58 | 23.57 | | 20 day SMA | 23.13 | 23.1 | 23.01 | | 35 day SMA | 20.82 | 20.65 | 20.44 | | 50 day SMA | 19.58 | 19.46 | 19.33 | | 100 day SMA | 17.32 | 17.23 | 17.14 | | 150 day SMA | 16.17 | 16.11 | 16.04 | | 200 day SMA | 15.64 | 15.6 | 15.55 |
|
|
