MercantileBank MBWM full analysis,charts,indicators,moving averages,SMA,DMA,EMA,ADX,MACD,RSIMercantile Bank MBWM WideScreen charts, DMA,SMA,EMA technical analysis, forecast prediction, by indicators ADX,MACD,RSI,CCI USA stock exchange
operates under Finance sector & deals in Major Banks
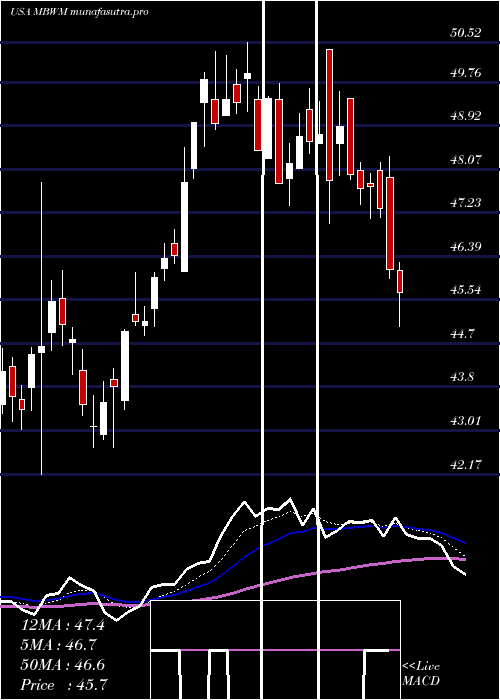
Daily price and charts and targets MercantileBank Strong Daily Stock price targets for MercantileBank MBWM are 45.11 and 46.11 | Daily Target 1 | 44.39 | | Daily Target 2 | 44.82 | | Daily Target 3 | 45.386666666667 | | Daily Target 4 | 45.82 | | Daily Target 5 | 46.39 |
Daily price and volume Mercantile Bank
| Date |
Closing |
Open |
Range |
Volume |
Wed 22 October 2025 |
45.26 (0.78%) |
44.95 |
44.95 - 45.95 |
0.8835 times |
Tue 21 October 2025 |
44.91 (0.63%) |
46.32 |
44.44 - 46.32 |
0.9333 times |
Mon 20 October 2025 |
44.63 (2.36%) |
43.90 |
43.51 - 45.15 |
0.8499 times |
Fri 17 October 2025 |
43.60 (1.07%) |
43.54 |
43.15 - 44.00 |
1.1283 times |
Thu 16 October 2025 |
43.14 (-5.15%) |
45.25 |
42.75 - 46.06 |
1.2332 times |
Wed 15 October 2025 |
45.48 (-1.69%) |
46.49 |
45.30 - 46.49 |
0.6818 times |
Tue 14 October 2025 |
46.26 (2.62%) |
44.86 |
44.81 - 46.52 |
0.9104 times |
Mon 13 October 2025 |
45.08 (2.11%) |
44.70 |
44.16 - 45.16 |
1.053 times |
Fri 10 October 2025 |
44.15 (-1.93%) |
44.94 |
43.98 - 45.44 |
1.5627 times |
Thu 09 October 2025 |
45.02 (-0.27%) |
44.92 |
44.75 - 45.18 |
0.7639 times |
Wed 08 October 2025 |
45.14 (-0.44%) |
45.58 |
45.06 - 45.72 |
0.5662 times |
Weekly price and charts MercantileBank Strong weekly Stock price targets for MercantileBank MBWM are 44.39 and 47.2 | Weekly Target 1 | 42.22 | | Weekly Target 2 | 43.74 | | Weekly Target 3 | 45.03 | | Weekly Target 4 | 46.55 | | Weekly Target 5 | 47.84 |
Weekly price and volumes for Mercantile Bank
| Date |
Closing |
Open |
Range |
Volume |
Wed 22 October 2025 |
45.26 (3.81%) |
43.90 |
43.51 - 46.32 |
0.7884 times |
Fri 17 October 2025 |
43.60 (-1.25%) |
44.70 |
42.75 - 46.52 |
1.4802 times |
Fri 10 October 2025 |
44.15 (-1.65%) |
45.28 |
43.98 - 46.10 |
1.5235 times |
Fri 03 October 2025 |
44.89 (-1.99%) |
45.92 |
44.38 - 46.28 |
1.1533 times |
Fri 26 September 2025 |
45.80 (-2.55%) |
46.83 |
45.43 - 47.33 |
1.0453 times |
Fri 19 September 2025 |
47.00 (-1.51%) |
47.79 |
46.35 - 49.36 |
1.4142 times |
Fri 12 September 2025 |
47.72 (-1.97%) |
48.86 |
47.54 - 48.94 |
0.6902 times |
Fri 05 September 2025 |
48.68 (-1.16%) |
48.62 |
48.07 - 49.79 |
0.782 times |
Fri 29 August 2025 |
49.25 (0%) |
49.88 |
49.08 - 50.01 |
0.1809 times |
Fri 29 August 2025 |
49.25 (-0.51%) |
49.47 |
47.37 - 50.23 |
0.9419 times |
Fri 22 August 2025 |
49.50 (6.93%) |
46.29 |
45.91 - 49.62 |
1.1876 times |

Monthly price and charts MercantileBank Strong monthly Stock price targets for MercantileBank MBWM are 44.01 and 47.78 | Monthly Target 1 | 41.07 | | Monthly Target 2 | 43.17 | | Monthly Target 3 | 44.843333333333 | | Monthly Target 4 | 46.94 | | Monthly Target 5 | 48.61 |
Monthly price and volumes Mercantile Bank
| Date |
Closing |
Open |
Range |
Volume |
Wed 22 October 2025 |
45.26 (0.58%) |
44.67 |
42.75 - 46.52 |
0.8363 times |
Tue 30 September 2025 |
45.00 (-8.63%) |
48.62 |
44.40 - 49.79 |
0.8328 times |
Fri 29 August 2025 |
49.25 (7.79%) |
45.08 |
43.71 - 50.23 |
0.9024 times |
Thu 31 July 2025 |
45.69 (-1.55%) |
46.09 |
45.03 - 50.52 |
1.6102 times |
Mon 30 June 2025 |
46.41 (5.1%) |
44.29 |
42.17 - 47.82 |
1.1064 times |
Fri 30 May 2025 |
44.16 (4.37%) |
42.31 |
41.35 - 46.97 |
0.7031 times |
Wed 30 April 2025 |
42.31 (-2.6%) |
43.07 |
37.76 - 43.90 |
0.8968 times |
Mon 31 March 2025 |
43.44 (-9.89%) |
48.13 |
42.03 - 48.66 |
0.9464 times |
Fri 28 February 2025 |
48.21 (-1.23%) |
47.18 |
45.37 - 51.89 |
0.9955 times |
Fri 31 January 2025 |
48.81 (9.71%) |
44.97 |
40.57 - 50.79 |
1.1699 times |
Tue 31 December 2024 |
44.49 (-11.2%) |
50.51 |
44.06 - 51.32 |
0.889 times |

DMA SMA EMA moving averages of Mercantile Bank MBWM
DMA (daily moving average) of Mercantile Bank MBWM
| DMA period | DMA value | | 5 day DMA | 44.31 | | 12 day DMA | 44.83 | | 20 day DMA | 44.98 | | 35 day DMA | 46.08 | | 50 day DMA | 46.77 | | 100 day DMA | 46.55 | | 150 day DMA | 45.27 | | 200 day DMA | 45.64 | EMA (exponential moving average) of Mercantile Bank MBWM
| EMA period | EMA current | EMA prev | EMA prev2 | | 5 day EMA | 44.81 | 44.58 | 44.41 | | 12 day EMA | 44.9 | 44.83 | 44.81 | | 20 day EMA | 45.2 | 45.19 | 45.22 | | 35 day EMA | 45.76 | 45.79 | 45.84 | | 50 day EMA | 46.42 | 46.47 | 46.53 |
SMA (simple moving average) of Mercantile Bank MBWM
| SMA period | SMA current | SMA prev | SMA prev2 | | 5 day SMA | 44.31 | 44.35 | 44.62 | | 12 day SMA | 44.83 | 44.87 | 44.87 | | 20 day SMA | 44.98 | 45.02 | 45.09 | | 35 day SMA | 46.08 | 46.18 | 46.3 | | 50 day SMA | 46.77 | 46.81 | 46.84 | | 100 day SMA | 46.55 | 46.54 | 46.54 | | 150 day SMA | 45.27 | 45.27 | 45.27 | | 200 day SMA | 45.64 | 45.63 | 45.63 |
|
|
