MalibuBoats MBUU full analysis,charts,indicators,moving averages,SMA,DMA,EMA,ADX,MACD,RSIMalibu Boats MBUU WideScreen charts, DMA,SMA,EMA technical analysis, forecast prediction, by indicators ADX,MACD,RSI,CCI USA stock exchange
operates under Capital Goods sector & deals in Marine Transportation
Daily price and charts and targets MalibuBoats Strong Daily Stock price targets for MalibuBoats MBUU are 30.64 and 31.38 | Daily Target 1 | 30.08 | | Daily Target 2 | 30.46 | | Daily Target 3 | 30.816666666667 | | Daily Target 4 | 31.2 | | Daily Target 5 | 31.56 |
Daily price and volume Malibu Boats
| Date |
Closing |
Open |
Range |
Volume |
Mon 20 October 2025 |
30.85 (1.98%) |
30.60 |
30.43 - 31.17 |
0.7169 times |
Fri 17 October 2025 |
30.25 (-0.13%) |
30.28 |
30.06 - 30.63 |
0.8921 times |
Thu 16 October 2025 |
30.29 (-0.53%) |
30.50 |
30.05 - 30.67 |
0.7646 times |
Wed 15 October 2025 |
30.45 (-0.26%) |
30.84 |
30.00 - 31.06 |
0.9223 times |
Tue 14 October 2025 |
30.53 (4.23%) |
29.00 |
29.00 - 30.77 |
1.0786 times |
Mon 13 October 2025 |
29.29 (2.02%) |
29.00 |
28.96 - 29.50 |
0.8886 times |
Fri 10 October 2025 |
28.71 (-4.17%) |
29.96 |
28.40 - 30.14 |
1.3133 times |
Thu 09 October 2025 |
29.96 (-0.76%) |
30.04 |
29.45 - 30.08 |
1.2419 times |
Wed 08 October 2025 |
30.19 (0.94%) |
29.93 |
29.53 - 30.20 |
0.9797 times |
Tue 07 October 2025 |
29.91 (-2.06%) |
30.51 |
29.83 - 30.72 |
1.2019 times |
Mon 06 October 2025 |
30.54 (-5.62%) |
32.51 |
30.50 - 32.51 |
1.3827 times |
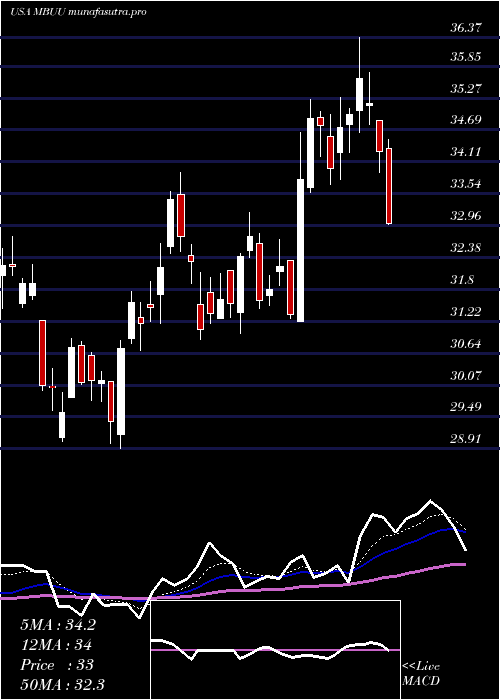
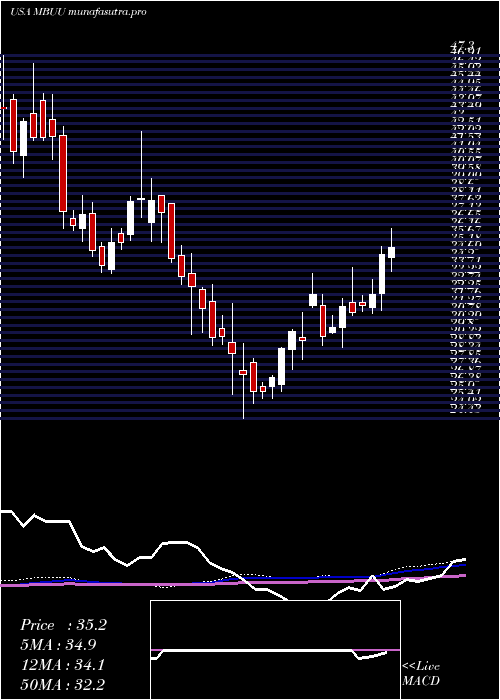
Weekly price and charts MalibuBoats Strong weekly Stock price targets for MalibuBoats MBUU are 30.64 and 31.38 | Weekly Target 1 | 30.08 | | Weekly Target 2 | 30.46 | | Weekly Target 3 | 30.816666666667 | | Weekly Target 4 | 31.2 | | Weekly Target 5 | 31.56 |
Weekly price and volumes for Malibu Boats
| Date |
Closing |
Open |
Range |
Volume |
Mon 20 October 2025 |
30.85 (1.98%) |
30.60 |
30.43 - 31.17 |
0.1119 times |
Fri 17 October 2025 |
30.25 (5.36%) |
29.00 |
28.96 - 31.06 |
0.7093 times |
Fri 10 October 2025 |
28.71 (-11.28%) |
32.51 |
28.40 - 32.51 |
0.9548 times |
Fri 03 October 2025 |
32.36 (-2.94%) |
33.53 |
31.29 - 33.53 |
0.9892 times |
Fri 26 September 2025 |
33.34 (3.93%) |
31.95 |
31.53 - 33.77 |
1.0892 times |
Fri 19 September 2025 |
32.08 (-1.78%) |
33.08 |
32.03 - 35.06 |
1.2376 times |
Fri 12 September 2025 |
32.66 (-2.97%) |
33.44 |
31.36 - 33.95 |
1.0877 times |
Fri 05 September 2025 |
33.66 (1.39%) |
32.48 |
31.34 - 34.00 |
1.0739 times |
Fri 29 August 2025 |
33.20 (0%) |
33.14 |
32.76 - 33.78 |
0.6139 times |
Fri 29 August 2025 |
33.20 (-15.28%) |
38.78 |
30.43 - 39.65 |
2.1327 times |
Fri 22 August 2025 |
39.19 (7.84%) |
36.39 |
35.14 - 39.43 |
0.684 times |
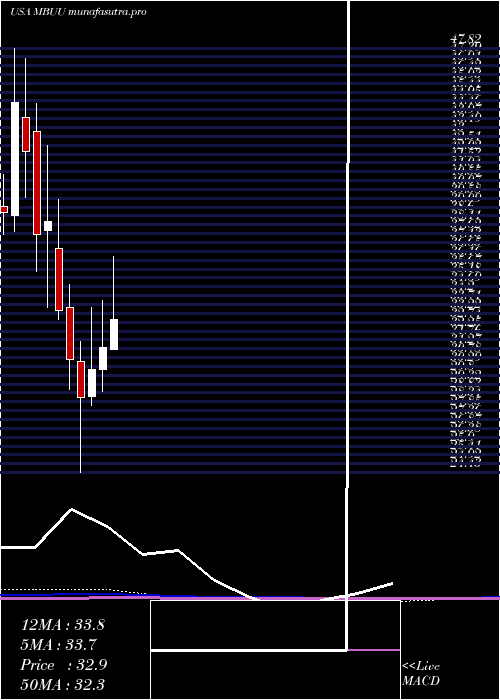
Monthly price and charts MalibuBoats Strong monthly Stock price targets for MalibuBoats MBUU are 27.21 and 32.05 | Monthly Target 1 | 25.99 | | Monthly Target 2 | 28.42 | | Monthly Target 3 | 30.83 | | Monthly Target 4 | 33.26 | | Monthly Target 5 | 35.67 |
Monthly price and volumes Malibu Boats
| Date |
Closing |
Open |
Range |
Volume |
Mon 20 October 2025 |
30.85 (-4.93%) |
32.39 |
28.40 - 33.24 |
0.5674 times |
Tue 30 September 2025 |
32.45 (-2.26%) |
32.48 |
31.29 - 35.06 |
1.2772 times |
Fri 29 August 2025 |
33.20 (-0.33%) |
32.74 |
30.43 - 39.65 |
1.2142 times |
Thu 31 July 2025 |
33.31 (6.29%) |
31.22 |
31.22 - 37.37 |
0.8029 times |
Mon 30 June 2025 |
31.34 (3.98%) |
30.13 |
28.91 - 33.92 |
0.7735 times |
Fri 30 May 2025 |
30.14 (5.53%) |
28.65 |
28.11 - 33.55 |
1.0162 times |
Wed 30 April 2025 |
28.56 (-6.91%) |
30.57 |
24.43 - 31.69 |
1.4675 times |
Mon 31 March 2025 |
30.68 (-8.09%) |
33.55 |
29.00 - 34.84 |
0.9186 times |
Fri 28 February 2025 |
33.38 (-12.82%) |
36.79 |
32.89 - 39.53 |
0.9089 times |
Fri 31 January 2025 |
38.29 (1.86%) |
37.80 |
33.56 - 42.49 |
1.0537 times |
Tue 31 December 2024 |
37.59 (-10.82%) |
43.29 |
35.56 - 44.81 |
0.6777 times |
DMA SMA EMA moving averages of Malibu Boats MBUU
DMA (daily moving average) of Malibu Boats MBUU
| DMA period | DMA value | | 5 day DMA | 30.47 | | 12 day DMA | 30.28 | | 20 day DMA | 31.16 | | 35 day DMA | 31.89 | | 50 day DMA | 33.23 | | 100 day DMA | 33.09 | | 150 day DMA | 31.85 | | 200 day DMA | 32.8 | EMA (exponential moving average) of Malibu Boats MBUU
| EMA period | EMA current | EMA prev | EMA prev2 | | 5 day EMA | 30.42 | 30.21 | 30.19 | | 12 day EMA | 30.59 | 30.54 | 30.59 | | 20 day EMA | 31.06 | 31.08 | 31.17 | | 35 day EMA | 31.96 | 32.03 | 32.13 | | 50 day EMA | 32.92 | 33 | 33.11 |
SMA (simple moving average) of Malibu Boats MBUU
| SMA period | SMA current | SMA prev | SMA prev2 | | 5 day SMA | 30.47 | 30.16 | 29.85 | | 12 day SMA | 30.28 | 30.4 | 30.62 | | 20 day SMA | 31.16 | 31.23 | 31.33 | | 35 day SMA | 31.89 | 31.95 | 32.04 | | 50 day SMA | 33.23 | 33.26 | 33.29 | | 100 day SMA | 33.09 | 33.09 | 33.08 | | 150 day SMA | 31.85 | 31.85 | 31.86 | | 200 day SMA | 32.8 | 32.83 | 32.86 |
|
|
