MustangBio MBIO full analysis,charts,indicators,moving averages,SMA,DMA,EMA,ADX,MACD,RSIMustang Bio MBIO WideScreen charts, DMA,SMA,EMA technical analysis, forecast prediction, by indicators ADX,MACD,RSI,CCI USA stock exchange
operates under Health Care sector & deals in Major Pharmaceuticals
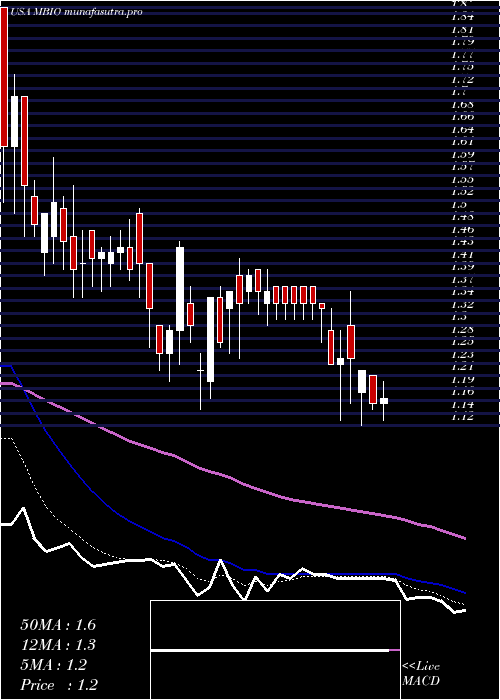
Daily price and charts and targets MustangBio Strong Daily Stock price targets for MustangBio MBIO are 1.54 and 1.73 | Daily Target 1 | 1.4 | | Daily Target 2 | 1.48 | | Daily Target 3 | 1.5866666666667 | | Daily Target 4 | 1.67 | | Daily Target 5 | 1.78 |
Daily price and volume Mustang Bio
| Date |
Closing |
Open |
Range |
Volume |
Mon 20 October 2025 |
1.57 (4.67%) |
1.56 |
1.50 - 1.69 |
0.8523 times |
Fri 17 October 2025 |
1.50 (-1.32%) |
1.52 |
1.45 - 1.52 |
0.4404 times |
Thu 16 October 2025 |
1.52 (-8.98%) |
1.66 |
1.47 - 1.68 |
1.3772 times |
Wed 15 October 2025 |
1.67 (1.21%) |
1.67 |
1.60 - 1.69 |
0.6378 times |
Tue 14 October 2025 |
1.65 (1.23%) |
1.62 |
1.60 - 1.69 |
0.9446 times |
Mon 13 October 2025 |
1.63 (6.54%) |
1.57 |
1.55 - 1.67 |
0.6151 times |
Fri 10 October 2025 |
1.53 (-13.56%) |
1.77 |
1.53 - 1.81 |
1.2712 times |
Thu 09 October 2025 |
1.77 (1.72%) |
1.74 |
1.71 - 1.85 |
0.6134 times |
Wed 08 October 2025 |
1.74 (-0.57%) |
1.76 |
1.69 - 1.82 |
1.1442 times |
Tue 07 October 2025 |
1.75 (11.46%) |
1.60 |
1.58 - 1.75 |
2.1038 times |
Mon 06 October 2025 |
1.57 (-0.63%) |
1.53 |
1.52 - 1.60 |
0.3338 times |
Weekly price and charts MustangBio Strong weekly Stock price targets for MustangBio MBIO are 1.54 and 1.73 | Weekly Target 1 | 1.4 | | Weekly Target 2 | 1.48 | | Weekly Target 3 | 1.5866666666667 | | Weekly Target 4 | 1.67 | | Weekly Target 5 | 1.78 |
Weekly price and volumes for Mustang Bio
| Date |
Closing |
Open |
Range |
Volume |
Mon 20 October 2025 |
1.57 (4.67%) |
1.56 |
1.50 - 1.69 |
0.3026 times |
Fri 17 October 2025 |
1.50 (-1.96%) |
1.57 |
1.45 - 1.69 |
1.4256 times |
Fri 10 October 2025 |
1.53 (-3.16%) |
1.53 |
1.52 - 1.85 |
1.941 times |
Fri 03 October 2025 |
1.58 (-0.63%) |
1.58 |
1.49 - 1.64 |
0.6631 times |
Fri 26 September 2025 |
1.59 (-4.79%) |
1.64 |
1.54 - 1.65 |
0.7992 times |
Fri 19 September 2025 |
1.67 (5.7%) |
1.63 |
1.54 - 1.78 |
1.2704 times |
Fri 12 September 2025 |
1.58 (10.49%) |
1.41 |
1.31 - 1.62 |
1.4802 times |
Fri 05 September 2025 |
1.43 (-5.3%) |
1.52 |
1.41 - 1.59 |
0.9217 times |
Fri 29 August 2025 |
1.51 (0%) |
1.56 |
1.51 - 1.56 |
0.1483 times |
Fri 29 August 2025 |
1.51 (-8.48%) |
1.65 |
1.50 - 1.68 |
1.0479 times |
Fri 22 August 2025 |
1.65 (-6.78%) |
1.70 |
1.56 - 1.77 |
0.9973 times |
Monthly price and charts MustangBio Strong monthly Stock price targets for MustangBio MBIO are 1.51 and 1.91 | Monthly Target 1 | 1.22 | | Monthly Target 2 | 1.4 | | Monthly Target 3 | 1.6233333333333 | | Monthly Target 4 | 1.8 | | Monthly Target 5 | 2.02 |
Monthly price and volumes Mustang Bio
| Date |
Closing |
Open |
Range |
Volume |
Mon 20 October 2025 |
1.57 (3.29%) |
1.53 |
1.45 - 1.85 |
0.0237 times |
Tue 30 September 2025 |
1.52 (0.66%) |
1.52 |
1.31 - 1.78 |
0.0281 times |
Fri 29 August 2025 |
1.51 (-1.31%) |
1.45 |
1.41 - 1.88 |
0.0355 times |
Thu 31 July 2025 |
1.53 (59.38%) |
0.95 |
0.89 - 7.00 |
4.1342 times |
Mon 30 June 2025 |
0.96 (-26.72%) |
1.28 |
0.95 - 1.31 |
0.0199 times |
Fri 30 May 2025 |
1.31 (20.18%) |
1.08 |
1.04 - 1.34 |
0.0324 times |
Wed 30 April 2025 |
1.09 (-12.8%) |
1.25 |
1.01 - 1.45 |
0.2405 times |
Mon 31 March 2025 |
1.25 (-37.5%) |
1.88 |
1.22 - 1.99 |
0.0171 times |
Fri 28 February 2025 |
2.00 (-53.7%) |
4.15 |
1.82 - 4.28 |
0.045 times |
Fri 31 January 2025 |
4.32 (2300%) |
0.18 |
0.11 - 6.70 |
5.4238 times |
Tue 31 December 2024 |
0.18 (-10%) |
0.20 |
0.15 - 0.21 |
0.1584 times |

DMA SMA EMA moving averages of Mustang Bio MBIO
DMA (daily moving average) of Mustang Bio MBIO
| DMA period | DMA value | | 5 day DMA | 1.58 | | 12 day DMA | 1.62 | | 20 day DMA | 1.6 | | 35 day DMA | 1.57 | | 50 day DMA | 1.59 | | 100 day DMA | 1.62 | | 150 day DMA | 1.5 | | 200 day DMA | 1.77 | EMA (exponential moving average) of Mustang Bio MBIO
| EMA period | EMA current | EMA prev | EMA prev2 | | 5 day EMA | 1.57 | 1.57 | 1.61 | | 12 day EMA | 1.59 | 1.59 | 1.61 | | 20 day EMA | 1.6 | 1.6 | 1.61 | | 35 day EMA | 1.59 | 1.59 | 1.6 | | 50 day EMA | 1.59 | 1.59 | 1.59 |
SMA (simple moving average) of Mustang Bio MBIO
| SMA period | SMA current | SMA prev | SMA prev2 | | 5 day SMA | 1.58 | 1.59 | 1.6 | | 12 day SMA | 1.62 | 1.62 | 1.62 | | 20 day SMA | 1.6 | 1.6 | 1.61 | | 35 day SMA | 1.57 | 1.57 | 1.57 | | 50 day SMA | 1.59 | 1.6 | 1.6 | | 100 day SMA | 1.62 | 1.62 | 1.62 | | 150 day SMA | 1.5 | 1.5 | 1.5 | | 200 day SMA | 1.77 | 1.76 | 1.76 |
|
|
