MerchantsBancorp MBIN full analysis,charts,indicators,moving averages,SMA,DMA,EMA,ADX,MACD,RSIMerchants Bancorp MBIN WideScreen charts, DMA,SMA,EMA technical analysis, forecast prediction, by indicators ADX,MACD,RSI,CCI USA stock exchange
operates under Finance sector & deals in Major Banks
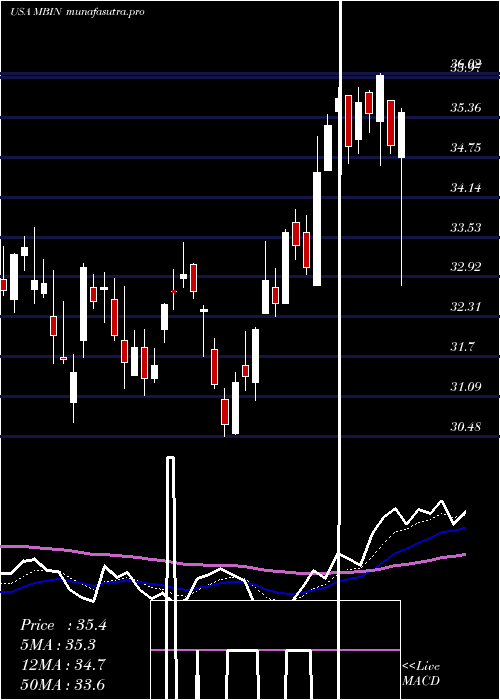
Daily price and charts and targets MerchantsBancorp Strong Daily Stock price targets for MerchantsBancorp MBIN are 34.41 and 34.98 | Daily Target 1 | 33.96 | | Daily Target 2 | 34.29 | | Daily Target 3 | 34.526666666667 | | Daily Target 4 | 34.86 | | Daily Target 5 | 35.1 |
Daily price and volume Merchants Bancorp
| Date |
Closing |
Open |
Range |
Volume |
Thu 04 December 2025 |
34.63 (0.49%) |
34.19 |
34.19 - 34.76 |
1.0419 times |
Wed 03 December 2025 |
34.46 (4.39%) |
33.23 |
32.78 - 34.66 |
1.1923 times |
Tue 02 December 2025 |
33.01 (-0.12%) |
33.26 |
32.81 - 34.04 |
0.9928 times |
Mon 01 December 2025 |
33.05 (1.1%) |
32.31 |
32.31 - 33.08 |
1.091 times |
Fri 28 November 2025 |
32.69 (-0.4%) |
32.70 |
32.59 - 32.89 |
0.5531 times |
Wed 26 November 2025 |
32.82 (0.46%) |
32.53 |
32.38 - 32.89 |
0.816 times |
Tue 25 November 2025 |
32.67 (4.24%) |
31.54 |
31.51 - 32.81 |
1.1062 times |
Mon 24 November 2025 |
31.34 (-0.29%) |
31.45 |
30.95 - 31.58 |
0.8274 times |
Fri 21 November 2025 |
31.43 (3.32%) |
30.47 |
30.43 - 31.66 |
1.2437 times |
Thu 20 November 2025 |
30.42 (-2.25%) |
31.50 |
30.37 - 31.75 |
1.1356 times |
Wed 19 November 2025 |
31.12 (-0.16%) |
31.11 |
30.83 - 31.49 |
1.2225 times |
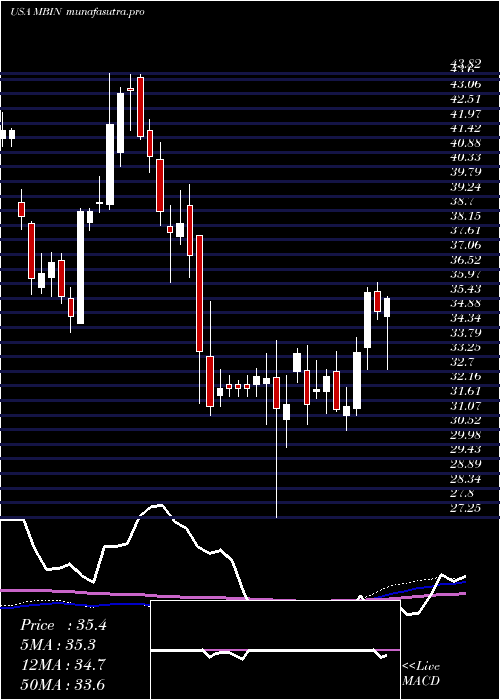
Weekly price and charts MerchantsBancorp Strong weekly Stock price targets for MerchantsBancorp MBIN are 33.47 and 35.92 | Weekly Target 1 | 31.45 | | Weekly Target 2 | 33.04 | | Weekly Target 3 | 33.9 | | Weekly Target 4 | 35.49 | | Weekly Target 5 | 36.35 |
Weekly price and volumes for Merchants Bancorp
| Date |
Closing |
Open |
Range |
Volume |
Thu 04 December 2025 |
34.63 (5.93%) |
32.31 |
32.31 - 34.76 |
0.8335 times |
Fri 28 November 2025 |
32.69 (4.01%) |
31.45 |
30.95 - 32.89 |
0.6375 times |
Fri 21 November 2025 |
31.43 (-1.69%) |
32.00 |
30.37 - 32.00 |
1.1349 times |
Fri 14 November 2025 |
31.97 (1.43%) |
31.78 |
31.38 - 32.87 |
0.9117 times |
Fri 07 November 2025 |
31.52 (1.06%) |
31.37 |
31.03 - 32.19 |
0.9042 times |
Fri 31 October 2025 |
31.19 (0%) |
31.17 |
31.00 - 31.78 |
0.2517 times |
Fri 31 October 2025 |
31.19 (-5.14%) |
32.94 |
31.00 - 33.64 |
1.3394 times |
Fri 24 October 2025 |
32.88 (6.37%) |
30.95 |
30.84 - 33.04 |
1.0934 times |
Fri 17 October 2025 |
30.91 (-0.99%) |
31.74 |
30.53 - 32.80 |
1.612 times |
Fri 10 October 2025 |
31.22 (-2.95%) |
32.50 |
31.11 - 32.79 |
1.2817 times |
Fri 03 October 2025 |
32.17 (0.37%) |
32.13 |
31.17 - 32.85 |
0.9711 times |
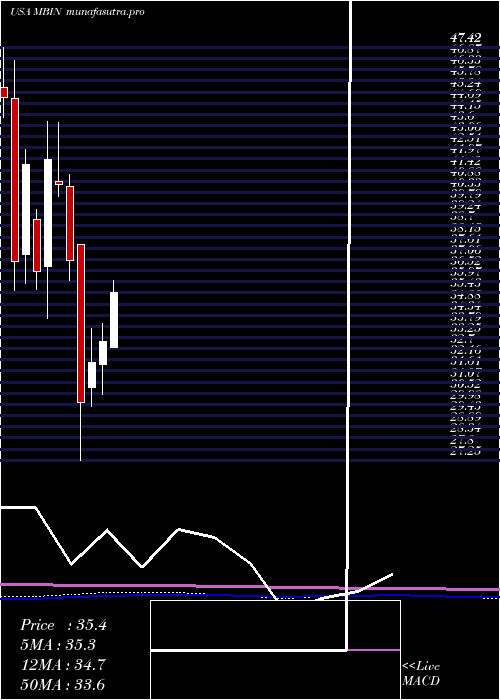
Monthly price and charts MerchantsBancorp Strong monthly Stock price targets for MerchantsBancorp MBIN are 33.47 and 35.92 | Monthly Target 1 | 31.45 | | Monthly Target 2 | 33.04 | | Monthly Target 3 | 33.9 | | Monthly Target 4 | 35.49 | | Monthly Target 5 | 36.35 |
Monthly price and volumes Merchants Bancorp
| Date |
Closing |
Open |
Range |
Volume |
Thu 04 December 2025 |
34.63 (5.93%) |
32.31 |
32.31 - 34.76 |
0.1756 times |
Fri 28 November 2025 |
32.69 (4.81%) |
31.37 |
30.37 - 32.89 |
0.7558 times |
Fri 31 October 2025 |
31.19 (-1.92%) |
31.64 |
30.53 - 33.64 |
1.2814 times |
Tue 30 September 2025 |
31.80 (-1.91%) |
32.14 |
31.17 - 33.53 |
0.9929 times |
Fri 29 August 2025 |
32.42 (10.65%) |
29.62 |
28.75 - 33.64 |
1.3401 times |
Thu 31 July 2025 |
29.30 (-11.4%) |
32.78 |
29.11 - 36.02 |
1.2615 times |
Mon 30 June 2025 |
33.07 (3.28%) |
31.95 |
30.48 - 33.95 |
1.1059 times |
Fri 30 May 2025 |
32.02 (6.45%) |
30.80 |
29.87 - 33.68 |
1.0431 times |
Wed 30 April 2025 |
30.08 (-18.7%) |
37.77 |
27.25 - 37.78 |
1.2092 times |
Mon 31 March 2025 |
37.00 (-9.14%) |
40.60 |
36.03 - 41.23 |
0.8346 times |
Fri 28 February 2025 |
40.72 (-2.89%) |
40.86 |
40.13 - 43.77 |
0.776 times |
DMA SMA EMA moving averages of Merchants Bancorp MBIN
DMA (daily moving average) of Merchants Bancorp MBIN
| DMA period | DMA value | | 5 day DMA | 33.57 | | 12 day DMA | 32.4 | | 20 day DMA | 32.16 | | 35 day DMA | 31.99 | | 50 day DMA | 32 | | 100 day DMA | 32.23 | | 150 day DMA | 32.39 | | 200 day DMA | 33.32 | EMA (exponential moving average) of Merchants Bancorp MBIN
| EMA period | EMA current | EMA prev | EMA prev2 | | 5 day EMA | 33.74 | 33.29 | 32.7 | | 12 day EMA | 32.9 | 32.58 | 32.24 | | 20 day EMA | 32.51 | 32.29 | 32.06 | | 35 day EMA | 32.26 | 32.12 | 31.98 | | 50 day EMA | 32.18 | 32.08 | 31.98 |
SMA (simple moving average) of Merchants Bancorp MBIN
| SMA period | SMA current | SMA prev | SMA prev2 | | 5 day SMA | 33.57 | 33.21 | 32.85 | | 12 day SMA | 32.4 | 32.11 | 31.9 | | 20 day SMA | 32.16 | 32.02 | 31.87 | | 35 day SMA | 31.99 | 31.92 | 31.86 | | 50 day SMA | 32 | 31.95 | 31.89 | | 100 day SMA | 32.23 | 32.22 | 32.23 | | 150 day SMA | 32.39 | 32.36 | 32.34 | | 200 day SMA | 33.32 | 33.36 | 33.41 |
|
|
