MbiaInc MBI full analysis,charts,indicators,moving averages,SMA,DMA,EMA,ADX,MACD,RSIMbia Inc MBI WideScreen charts, DMA,SMA,EMA technical analysis, forecast prediction, by indicators ADX,MACD,RSI,CCI USA stock exchange
operates under Finance sector & deals in Property Casualty Insurers
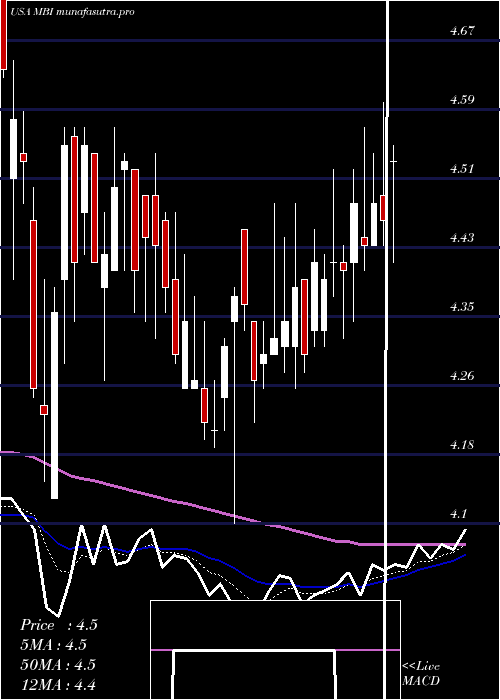
Daily price and charts and targets MbiaInc Strong Daily Stock price targets for MbiaInc MBI are 7.45 and 7.7 | Daily Target 1 | 7.4 | | Daily Target 2 | 7.49 | | Daily Target 3 | 7.65 | | Daily Target 4 | 7.74 | | Daily Target 5 | 7.9 |
Daily price and volume Mbia Inc
| Date |
Closing |
Open |
Range |
Volume |
Thu 04 December 2025 |
7.58 (-1.3%) |
7.65 |
7.56 - 7.81 |
0.7873 times |
Wed 03 December 2025 |
7.68 (6.52%) |
7.23 |
7.23 - 7.71 |
1.1773 times |
Tue 02 December 2025 |
7.21 (-2.3%) |
7.36 |
7.18 - 7.38 |
1.2348 times |
Mon 01 December 2025 |
7.38 (-2.25%) |
7.57 |
7.36 - 7.60 |
0.8236 times |
Fri 28 November 2025 |
7.55 (0.13%) |
7.57 |
7.51 - 7.73 |
0.5455 times |
Wed 26 November 2025 |
7.54 (0.27%) |
7.50 |
7.34 - 7.58 |
1.2873 times |
Tue 25 November 2025 |
7.52 (0.67%) |
7.51 |
7.47 - 7.62 |
1.0022 times |
Mon 24 November 2025 |
7.47 (-1.97%) |
7.58 |
7.43 - 7.63 |
0.8595 times |
Fri 21 November 2025 |
7.62 (2.83%) |
7.50 |
7.48 - 7.73 |
1.0466 times |
Thu 20 November 2025 |
7.41 (-3.01%) |
7.73 |
7.40 - 7.81 |
1.236 times |
Wed 19 November 2025 |
7.64 (0%) |
7.70 |
7.60 - 7.80 |
0.9382 times |
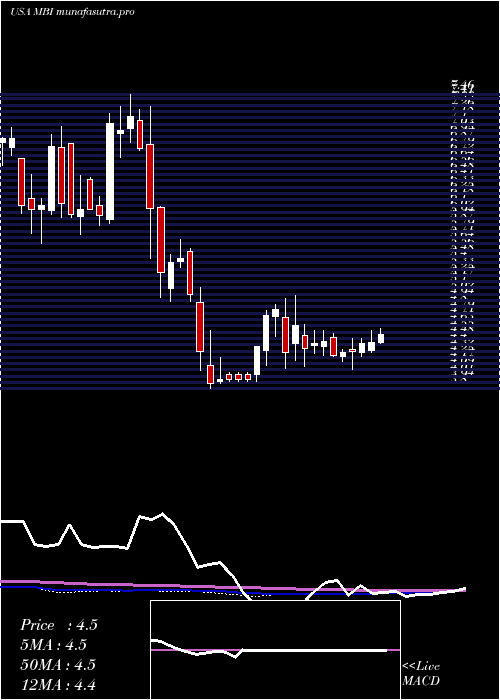
Weekly price and charts MbiaInc Strong weekly Stock price targets for MbiaInc MBI are 7.38 and 8.01 | Weekly Target 1 | 6.89 | | Weekly Target 2 | 7.24 | | Weekly Target 3 | 7.5233333333333 | | Weekly Target 4 | 7.87 | | Weekly Target 5 | 8.15 |
Weekly price and volumes for Mbia Inc
| Date |
Closing |
Open |
Range |
Volume |
Thu 04 December 2025 |
7.58 (0.4%) |
7.57 |
7.18 - 7.81 |
0.9327 times |
Fri 28 November 2025 |
7.55 (-0.92%) |
7.58 |
7.34 - 7.73 |
0.8565 times |
Fri 21 November 2025 |
7.62 (-1.3%) |
7.71 |
7.40 - 7.84 |
1.2294 times |
Fri 14 November 2025 |
7.72 (3.07%) |
7.57 |
7.39 - 7.87 |
1.7967 times |
Fri 07 November 2025 |
7.49 (9.66%) |
6.77 |
6.68 - 7.54 |
1.4059 times |
Fri 31 October 2025 |
6.83 (0%) |
6.69 |
6.65 - 6.87 |
0.3034 times |
Fri 31 October 2025 |
6.83 (-0.87%) |
6.93 |
6.53 - 6.93 |
1.02 times |
Fri 24 October 2025 |
6.89 (3.3%) |
6.75 |
6.74 - 7.10 |
0.921 times |
Fri 17 October 2025 |
6.67 (-6.06%) |
6.87 |
6.30 - 7.07 |
1.0338 times |
Tue 07 October 2025 |
7.10 (-2.07%) |
7.27 |
7.06 - 7.55 |
0.5006 times |
Fri 03 October 2025 |
7.25 (-4.73%) |
7.58 |
7.02 - 7.66 |
1.1117 times |
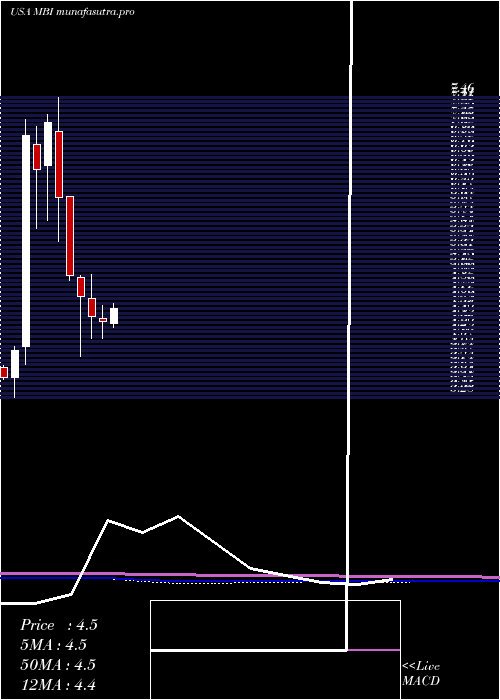
Monthly price and charts MbiaInc Strong monthly Stock price targets for MbiaInc MBI are 7.38 and 8.01 | Monthly Target 1 | 6.89 | | Monthly Target 2 | 7.24 | | Monthly Target 3 | 7.5233333333333 | | Monthly Target 4 | 7.87 | | Monthly Target 5 | 8.15 |
Monthly price and volumes Mbia Inc
| Date |
Closing |
Open |
Range |
Volume |
Thu 04 December 2025 |
7.58 (0.4%) |
7.57 |
7.18 - 7.81 |
0.1706 times |
Fri 28 November 2025 |
7.55 (10.54%) |
6.77 |
6.68 - 7.87 |
0.9674 times |
Fri 31 October 2025 |
6.83 (-8.32%) |
7.38 |
6.30 - 7.55 |
0.8048 times |
Tue 30 September 2025 |
7.45 (-6.41%) |
7.89 |
6.85 - 8.17 |
1.2925 times |
Fri 29 August 2025 |
7.96 (49.34%) |
5.29 |
5.23 - 8.26 |
2.1324 times |
Thu 31 July 2025 |
5.33 (22.81%) |
4.31 |
4.26 - 5.35 |
0.7431 times |
Mon 30 June 2025 |
4.34 (-1.59%) |
4.38 |
4.10 - 4.57 |
0.6268 times |
Fri 30 May 2025 |
4.41 (-5.97%) |
4.67 |
4.11 - 5.00 |
0.9257 times |
Wed 30 April 2025 |
4.69 (-5.82%) |
4.95 |
3.86 - 4.99 |
1.1939 times |
Mon 31 March 2025 |
4.98 (-17.96%) |
6.08 |
4.91 - 6.09 |
1.1428 times |
Fri 28 February 2025 |
6.07 (-14.63%) |
6.99 |
5.46 - 7.46 |
1.2144 times |
DMA SMA EMA moving averages of Mbia Inc MBI
DMA (daily moving average) of Mbia Inc MBI
| DMA period | DMA value | | 5 day DMA | 7.48 | | 12 day DMA | 7.52 | | 20 day DMA | 7.53 | | 35 day DMA | 7.23 | | 50 day DMA | 7.26 | | 100 day DMA | 6.87 | | 150 day DMA | 6.06 | | 200 day DMA | 5.85 | EMA (exponential moving average) of Mbia Inc MBI
| EMA period | EMA current | EMA prev | EMA prev2 | | 5 day EMA | 7.52 | 7.49 | 7.4 | | 12 day EMA | 7.5 | 7.49 | 7.45 | | 20 day EMA | 7.44 | 7.43 | 7.4 | | 35 day EMA | 7.41 | 7.4 | 7.38 | | 50 day EMA | 7.29 | 7.28 | 7.26 |
SMA (simple moving average) of Mbia Inc MBI
| SMA period | SMA current | SMA prev | SMA prev2 | | 5 day SMA | 7.48 | 7.47 | 7.44 | | 12 day SMA | 7.52 | 7.52 | 7.52 | | 20 day SMA | 7.53 | 7.52 | 7.47 | | 35 day SMA | 7.23 | 7.21 | 7.18 | | 50 day SMA | 7.26 | 7.26 | 7.26 | | 100 day SMA | 6.87 | 6.84 | 6.81 | | 150 day SMA | 6.06 | 6.05 | 6.03 | | 200 day SMA | 5.85 | 5.85 | 5.85 |
|
|
