MatsonInc MATX full analysis,charts,indicators,moving averages,SMA,DMA,EMA,ADX,MACD,RSIMatson Inc MATX WideScreen charts, DMA,SMA,EMA technical analysis, forecast prediction, by indicators ADX,MACD,RSI,CCI USA stock exchange
operates under Consumer Services sector & deals in Marine Transportation
Daily price and charts and targets MatsonInc Strong Daily Stock price targets for MatsonInc MATX are 93.4 and 95.04 | Daily Target 1 | 93.04 | | Daily Target 2 | 93.75 | | Daily Target 3 | 94.676666666667 | | Daily Target 4 | 95.39 | | Daily Target 5 | 96.32 |
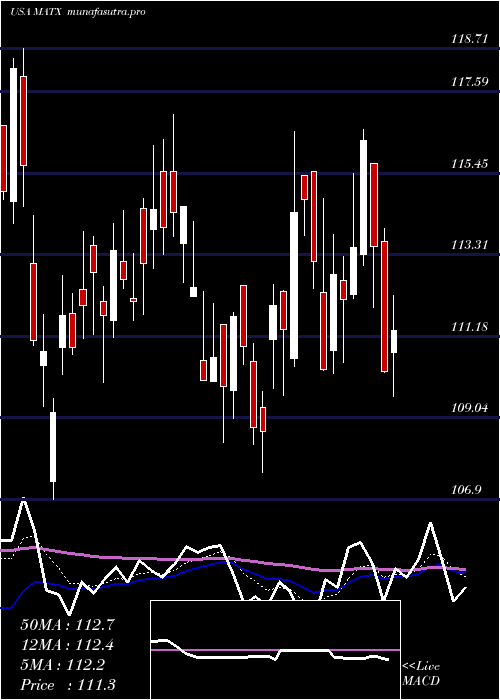
Daily price and volume Matson Inc
| Date |
Closing |
Open |
Range |
Volume |
Mon 20 October 2025 |
94.47 (-0.02%) |
94.62 |
93.96 - 95.60 |
0.4554 times |
Fri 17 October 2025 |
94.49 (0.66%) |
94.00 |
93.11 - 95.01 |
0.6981 times |
Thu 16 October 2025 |
93.87 (-0.78%) |
95.17 |
93.70 - 95.96 |
0.8255 times |
Wed 15 October 2025 |
94.61 (1.75%) |
93.23 |
93.14 - 95.71 |
1.1579 times |
Tue 14 October 2025 |
92.98 (3.18%) |
88.59 |
88.59 - 93.19 |
1.0103 times |
Mon 13 October 2025 |
90.11 (2.34%) |
89.46 |
88.50 - 91.13 |
1.4657 times |
Fri 10 October 2025 |
88.05 (-6.47%) |
92.04 |
86.97 - 92.04 |
1.8957 times |
Thu 09 October 2025 |
94.14 (-3.42%) |
97.57 |
94.06 - 97.57 |
0.824 times |
Wed 08 October 2025 |
97.47 (1.21%) |
96.54 |
95.22 - 97.77 |
0.7614 times |
Tue 07 October 2025 |
96.30 (-2.48%) |
98.16 |
96.22 - 99.60 |
0.9061 times |
Mon 06 October 2025 |
98.75 (-1.63%) |
101.08 |
98.74 - 101.08 |
0.5006 times |
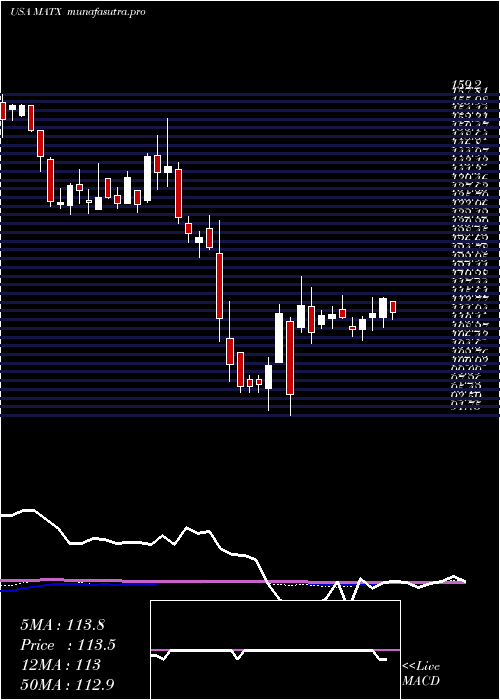
Weekly price and charts MatsonInc Strong weekly Stock price targets for MatsonInc MATX are 93.4 and 95.04 | Weekly Target 1 | 93.04 | | Weekly Target 2 | 93.75 | | Weekly Target 3 | 94.676666666667 | | Weekly Target 4 | 95.39 | | Weekly Target 5 | 96.32 |
Weekly price and volumes for Matson Inc
| Date |
Closing |
Open |
Range |
Volume |
Mon 20 October 2025 |
94.47 (-0.02%) |
94.62 |
93.96 - 95.60 |
0.1368 times |
Fri 17 October 2025 |
94.49 (7.31%) |
89.46 |
88.50 - 95.96 |
1.5494 times |
Fri 10 October 2025 |
88.05 (-12.29%) |
101.08 |
86.97 - 101.08 |
1.4683 times |
Fri 03 October 2025 |
100.39 (-2.33%) |
103.06 |
97.13 - 103.06 |
1.0071 times |
Fri 26 September 2025 |
102.78 (-0.94%) |
103.68 |
102.01 - 105.93 |
0.7928 times |
Fri 19 September 2025 |
103.76 (0.41%) |
104.47 |
103.44 - 109.70 |
1.8883 times |
Fri 12 September 2025 |
103.34 (-2.1%) |
105.83 |
101.54 - 106.46 |
0.9597 times |
Fri 05 September 2025 |
105.56 (1.45%) |
102.00 |
100.28 - 106.00 |
1.0054 times |
Fri 29 August 2025 |
104.05 (0%) |
105.34 |
103.81 - 105.74 |
0.2603 times |
Fri 29 August 2025 |
104.05 (-2.13%) |
106.00 |
103.20 - 107.51 |
0.9319 times |
Fri 22 August 2025 |
106.31 (1.27%) |
104.59 |
100.51 - 108.29 |
1.4045 times |
Monthly price and charts MatsonInc Strong monthly Stock price targets for MatsonInc MATX are 83.46 and 97.98 | Monthly Target 1 | 79.79 | | Monthly Target 2 | 87.13 | | Monthly Target 3 | 94.31 | | Monthly Target 4 | 101.65 | | Monthly Target 5 | 108.83 |
Monthly price and volumes Matson Inc
| Date |
Closing |
Open |
Range |
Volume |
Mon 20 October 2025 |
94.47 (-4.18%) |
98.07 |
86.97 - 101.49 |
0.6299 times |
Tue 30 September 2025 |
98.59 (-5.25%) |
102.00 |
97.13 - 109.70 |
0.8895 times |
Fri 29 August 2025 |
104.05 (-2.56%) |
114.49 |
100.51 - 114.49 |
0.9905 times |
Thu 31 July 2025 |
106.78 (-4.1%) |
110.60 |
103.40 - 116.61 |
1.0466 times |
Mon 30 June 2025 |
111.35 (-1.33%) |
112.08 |
107.60 - 117.00 |
0.8832 times |
Fri 30 May 2025 |
112.85 (3.45%) |
108.52 |
91.75 - 121.00 |
1.7486 times |
Wed 30 April 2025 |
109.09 (-14.89%) |
128.17 |
92.90 - 132.75 |
1.2717 times |
Mon 31 March 2025 |
128.17 (-11.04%) |
143.52 |
124.00 - 145.00 |
1.0582 times |
Fri 28 February 2025 |
144.07 (1.57%) |
139.11 |
134.57 - 154.23 |
0.8493 times |
Fri 31 January 2025 |
141.85 (5.2%) |
137.73 |
134.34 - 144.71 |
0.6326 times |
Tue 31 December 2024 |
134.84 (-14.1%) |
156.95 |
134.14 - 156.95 |
0.5172 times |
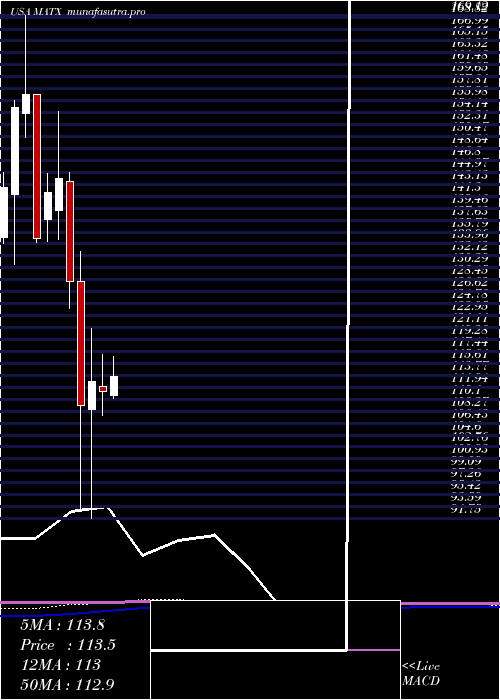
DMA SMA EMA moving averages of Matson Inc MATX
DMA (daily moving average) of Matson Inc MATX
| DMA period | DMA value | | 5 day DMA | 94.08 | | 12 day DMA | 94.64 | | 20 day DMA | 97.38 | | 35 day DMA | 100.42 | | 50 day DMA | 101.83 | | 100 day DMA | 106.33 | | 150 day DMA | 108.21 | | 200 day DMA | 115.88 | EMA (exponential moving average) of Matson Inc MATX
| EMA period | EMA current | EMA prev | EMA prev2 | | 5 day EMA | 94.06 | 93.86 | 93.54 | | 12 day EMA | 95.07 | 95.18 | 95.31 | | 20 day EMA | 96.8 | 97.04 | 97.31 | | 35 day EMA | 99.14 | 99.42 | 99.71 | | 50 day EMA | 101.68 | 101.97 | 102.28 |
SMA (simple moving average) of Matson Inc MATX
| SMA period | SMA current | SMA prev | SMA prev2 | | 5 day SMA | 94.08 | 93.21 | 91.92 | | 12 day SMA | 94.64 | 95.05 | 95.41 | | 20 day SMA | 97.38 | 97.89 | 98.35 | | 35 day SMA | 100.42 | 100.7 | 100.97 | | 50 day SMA | 101.83 | 102.02 | 102.28 | | 100 day SMA | 106.33 | 106.51 | 106.65 | | 150 day SMA | 108.21 | 108.44 | 108.69 | | 200 day SMA | 115.88 | 116.08 | 116.29 |
|
|
