MatthewsInternational MATW full analysis,charts,indicators,moving averages,SMA,DMA,EMA,ADX,MACD,RSIMatthews International MATW WideScreen charts, DMA,SMA,EMA technical analysis, forecast prediction, by indicators ADX,MACD,RSI,CCI USA stock exchange
operates under Capital Goods sector & deals in Metal Fabrications
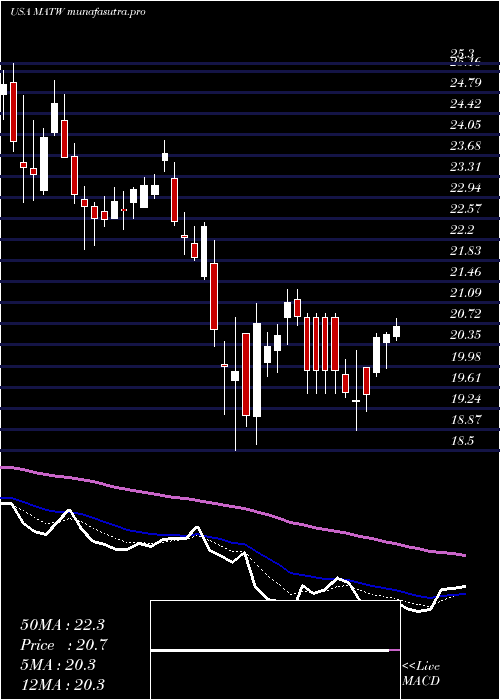
Daily price and charts and targets MatthewsInternational Strong Daily Stock price targets for MatthewsInternational MATW are 23.74 and 24.69 | Daily Target 1 | 23.49 | | Daily Target 2 | 23.99 | | Daily Target 3 | 24.436666666667 | | Daily Target 4 | 24.94 | | Daily Target 5 | 25.39 |
Daily price and volume Matthews International
| Date |
Closing |
Open |
Range |
Volume |
Thu 04 December 2025 |
24.50 (-1.17%) |
24.61 |
23.93 - 24.88 |
1.0091 times |
Wed 03 December 2025 |
24.79 (1.39%) |
24.40 |
24.37 - 25.10 |
0.7371 times |
Tue 02 December 2025 |
24.45 (-0.16%) |
24.55 |
24.06 - 24.63 |
0.4767 times |
Mon 01 December 2025 |
24.49 (-0.2%) |
24.23 |
23.90 - 24.51 |
0.729 times |
Fri 28 November 2025 |
24.54 (-1.52%) |
24.96 |
24.22 - 25.01 |
0.523 times |
Wed 26 November 2025 |
24.92 (-1.07%) |
25.01 |
24.64 - 25.24 |
1.3336 times |
Tue 25 November 2025 |
25.19 (4.09%) |
24.45 |
24.01 - 25.55 |
1.1325 times |
Mon 24 November 2025 |
24.20 (-1.26%) |
24.40 |
23.57 - 24.50 |
1.7785 times |
Fri 21 November 2025 |
24.51 (-0.57%) |
24.94 |
24.00 - 25.34 |
1.332 times |
Thu 20 November 2025 |
24.65 (-0.76%) |
25.26 |
24.50 - 25.70 |
0.9486 times |
Wed 19 November 2025 |
24.84 (1.18%) |
24.51 |
24.50 - 25.02 |
0.7455 times |
Weekly price and charts MatthewsInternational Strong weekly Stock price targets for MatthewsInternational MATW are 24.2 and 25.4 | Weekly Target 1 | 23.3 | | Weekly Target 2 | 23.9 | | Weekly Target 3 | 24.5 | | Weekly Target 4 | 25.1 | | Weekly Target 5 | 25.7 |
Weekly price and volumes for Matthews International
| Date |
Closing |
Open |
Range |
Volume |
Thu 04 December 2025 |
24.50 (-0.16%) |
24.23 |
23.90 - 25.10 |
0.7504 times |
Fri 28 November 2025 |
24.54 (0.12%) |
24.40 |
23.57 - 25.55 |
1.212 times |
Fri 21 November 2025 |
24.51 (-2.93%) |
25.08 |
24.00 - 25.70 |
1.5788 times |
Fri 14 November 2025 |
25.25 (9.73%) |
23.11 |
22.94 - 26.67 |
1.5815 times |
Fri 07 November 2025 |
23.01 (-1.75%) |
23.20 |
22.65 - 23.38 |
1.1792 times |
Fri 31 October 2025 |
23.42 (0%) |
22.98 |
22.26 - 23.44 |
0.2848 times |
Fri 31 October 2025 |
23.42 (-0.85%) |
23.71 |
22.26 - 23.71 |
1.1287 times |
Fri 24 October 2025 |
23.62 (2.03%) |
23.35 |
22.97 - 24.00 |
0.5722 times |
Fri 17 October 2025 |
23.15 (3.26%) |
22.70 |
21.95 - 23.46 |
0.7503 times |
Fri 10 October 2025 |
22.42 (-9.34%) |
24.92 |
22.35 - 25.12 |
0.962 times |
Fri 03 October 2025 |
24.73 (2.74%) |
24.18 |
23.66 - 26.44 |
0.9577 times |
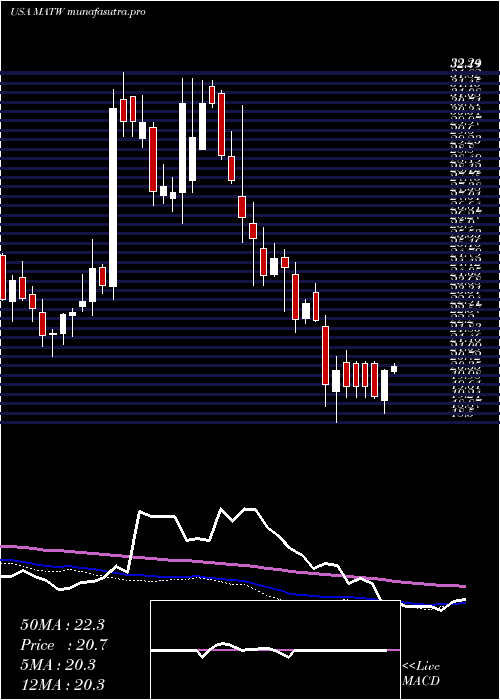
Monthly price and charts MatthewsInternational Strong monthly Stock price targets for MatthewsInternational MATW are 24.2 and 25.4 | Monthly Target 1 | 23.3 | | Monthly Target 2 | 23.9 | | Monthly Target 3 | 24.5 | | Monthly Target 4 | 25.1 | | Monthly Target 5 | 25.7 |
Monthly price and volumes Matthews International
| Date |
Closing |
Open |
Range |
Volume |
Thu 04 December 2025 |
24.50 (-0.16%) |
24.23 |
23.90 - 25.10 |
0.2009 times |
Fri 28 November 2025 |
24.54 (4.78%) |
23.20 |
22.65 - 26.67 |
1.4859 times |
Fri 31 October 2025 |
23.42 (-3.54%) |
24.01 |
21.95 - 26.44 |
1.1949 times |
Tue 30 September 2025 |
24.28 (-1.18%) |
24.35 |
23.66 - 26.15 |
0.8741 times |
Fri 29 August 2025 |
24.57 (4.6%) |
23.21 |
22.80 - 26.50 |
0.9741 times |
Thu 31 July 2025 |
23.49 (-1.76%) |
23.71 |
23.22 - 25.90 |
0.8718 times |
Mon 30 June 2025 |
23.91 (11.47%) |
21.43 |
20.73 - 24.59 |
0.9517 times |
Fri 30 May 2025 |
21.45 (4.89%) |
19.10 |
18.61 - 22.50 |
1.372 times |
Wed 30 April 2025 |
20.45 (-8.05%) |
22.13 |
18.50 - 22.50 |
1.2066 times |
Mon 31 March 2025 |
22.24 (-10.75%) |
24.97 |
21.94 - 25.30 |
0.8681 times |
Fri 28 February 2025 |
24.92 (-10.97%) |
27.37 |
23.87 - 30.96 |
1.5131 times |

DMA SMA EMA moving averages of Matthews International MATW
DMA (daily moving average) of Matthews International MATW
| DMA period | DMA value | | 5 day DMA | 24.55 | | 12 day DMA | 24.64 | | 20 day DMA | 24.39 | | 35 day DMA | 23.93 | | 50 day DMA | 23.85 | | 100 day DMA | 24.18 | | 150 day DMA | 23.48 | | 200 day DMA | 23.16 | EMA (exponential moving average) of Matthews International MATW
| EMA period | EMA current | EMA prev | EMA prev2 | | 5 day EMA | 24.59 | 24.64 | 24.56 | | 12 day EMA | 24.53 | 24.54 | 24.5 | | 20 day EMA | 24.4 | 24.39 | 24.35 | | 35 day EMA | 24.25 | 24.23 | 24.2 | | 50 day EMA | 24.02 | 24 | 23.97 |
SMA (simple moving average) of Matthews International MATW
| SMA period | SMA current | SMA prev | SMA prev2 | | 5 day SMA | 24.55 | 24.64 | 24.72 | | 12 day SMA | 24.64 | 24.62 | 24.66 | | 20 day SMA | 24.39 | 24.32 | 24.24 | | 35 day SMA | 23.93 | 23.89 | 23.84 | | 50 day SMA | 23.85 | 23.85 | 23.86 | | 100 day SMA | 24.18 | 24.18 | 24.18 | | 150 day SMA | 23.48 | 23.46 | 23.43 | | 200 day SMA | 23.16 | 23.17 | 23.17 |
|
|
