MasimoCorporation MASI full analysis,charts,indicators,moving averages,SMA,DMA,EMA,ADX,MACD,RSIMasimo Corporation MASI WideScreen charts, DMA,SMA,EMA technical analysis, forecast prediction, by indicators ADX,MACD,RSI,CCI USA stock exchange
operates under Health Care sector & deals in Biotechnology Electromedical Electrotherapeutic Apparatus
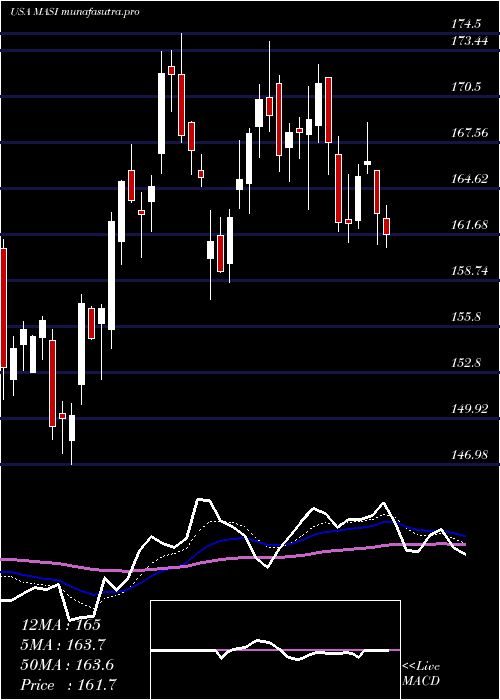
Daily price and charts and targets MasimoCorporation Strong Daily Stock price targets for MasimoCorporation MASI are 145.64 and 148.03 | Daily Target 1 | 145.18 | | Daily Target 2 | 146.1 | | Daily Target 3 | 147.57333333333 | | Daily Target 4 | 148.49 | | Daily Target 5 | 149.96 |
Daily price and volume Masimo Corporation
| Date |
Closing |
Open |
Range |
Volume |
Mon 20 October 2025 |
147.01 (0.16%) |
148.10 |
146.66 - 149.05 |
1.0058 times |
Fri 17 October 2025 |
146.78 (-0.3%) |
145.96 |
145.00 - 147.89 |
0.9464 times |
Thu 16 October 2025 |
147.22 (-0.9%) |
149.34 |
145.58 - 150.00 |
0.7911 times |
Wed 15 October 2025 |
148.56 (0.75%) |
147.48 |
145.88 - 149.30 |
0.719 times |
Tue 14 October 2025 |
147.45 (-0.38%) |
146.21 |
145.72 - 151.68 |
0.8046 times |
Mon 13 October 2025 |
148.01 (2.33%) |
146.33 |
145.31 - 148.24 |
0.9403 times |
Fri 10 October 2025 |
144.64 (-3.91%) |
151.13 |
144.10 - 151.16 |
0.9519 times |
Thu 09 October 2025 |
150.53 (-2.08%) |
155.09 |
149.70 - 155.99 |
1.0045 times |
Wed 08 October 2025 |
153.72 (2.31%) |
150.84 |
148.99 - 154.23 |
1.0185 times |
Tue 07 October 2025 |
150.25 (1.43%) |
149.35 |
148.49 - 152.43 |
1.8179 times |
Mon 06 October 2025 |
148.13 (0.57%) |
147.48 |
146.43 - 149.37 |
1.4216 times |
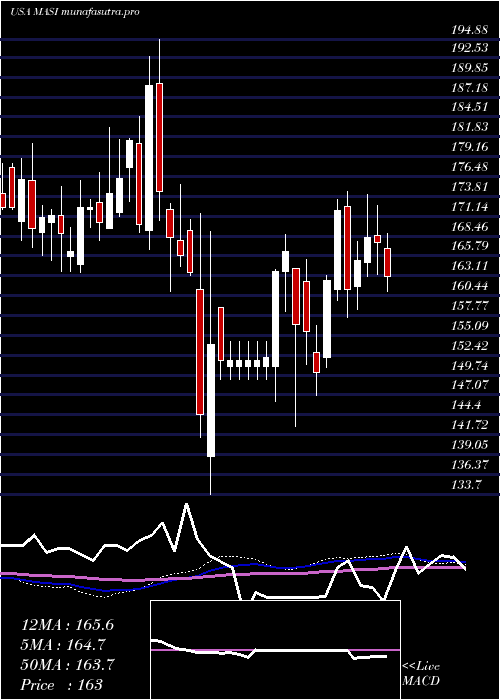
Weekly price and charts MasimoCorporation Strong weekly Stock price targets for MasimoCorporation MASI are 145.64 and 148.03 | Weekly Target 1 | 145.18 | | Weekly Target 2 | 146.1 | | Weekly Target 3 | 147.57333333333 | | Weekly Target 4 | 148.49 | | Weekly Target 5 | 149.96 |
Weekly price and volumes for Masimo Corporation
| Date |
Closing |
Open |
Range |
Volume |
Mon 20 October 2025 |
147.01 (0.16%) |
148.10 |
146.66 - 149.05 |
0.2366 times |
Fri 17 October 2025 |
146.78 (1.48%) |
146.33 |
145.00 - 151.68 |
0.9884 times |
Fri 10 October 2025 |
144.64 (-1.8%) |
147.48 |
144.10 - 155.99 |
1.462 times |
Fri 03 October 2025 |
147.29 (4.17%) |
142.72 |
140.51 - 149.19 |
1.2223 times |
Fri 26 September 2025 |
141.40 (0.69%) |
139.99 |
136.64 - 143.97 |
1.2386 times |
Fri 19 September 2025 |
140.43 (-4.75%) |
148.07 |
140.11 - 148.95 |
1.5092 times |
Fri 12 September 2025 |
147.44 (0.17%) |
147.19 |
143.90 - 149.95 |
1.061 times |
Fri 05 September 2025 |
147.19 (5.35%) |
137.00 |
135.34 - 148.08 |
0.9922 times |
Fri 29 August 2025 |
139.71 (0%) |
141.26 |
138.77 - 141.93 |
0.174 times |
Fri 29 August 2025 |
139.71 (-6%) |
146.68 |
138.77 - 147.67 |
1.1157 times |
Fri 22 August 2025 |
148.63 (-3.41%) |
153.45 |
143.11 - 155.88 |
1.2756 times |
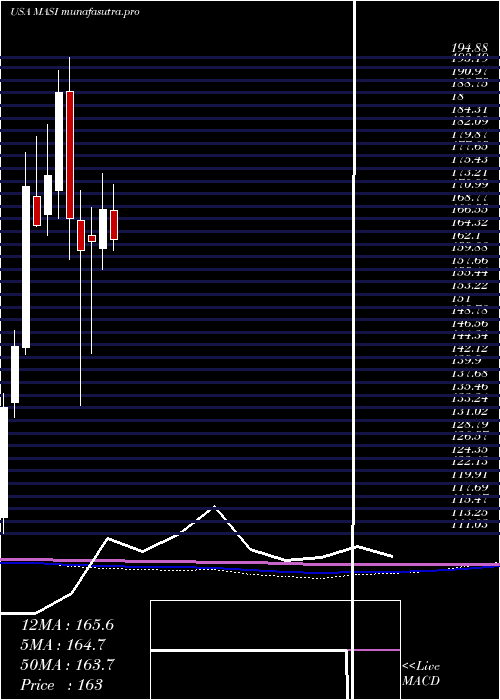
Monthly price and charts MasimoCorporation Strong monthly Stock price targets for MasimoCorporation MASI are 136.33 and 151.5 | Monthly Target 1 | 132.77 | | Monthly Target 2 | 139.89 | | Monthly Target 3 | 147.94 | | Monthly Target 4 | 155.06 | | Monthly Target 5 | 163.11 |
Monthly price and volumes Masimo Corporation
| Date |
Closing |
Open |
Range |
Volume |
Mon 20 October 2025 |
147.01 (-0.37%) |
147.26 |
140.82 - 155.99 |
0.7147 times |
Tue 30 September 2025 |
147.55 (5.61%) |
137.00 |
135.34 - 149.95 |
1.1144 times |
Fri 29 August 2025 |
139.71 (-9.16%) |
153.81 |
135.83 - 164.32 |
1.4107 times |
Thu 31 July 2025 |
153.79 (-8.58%) |
168.04 |
152.73 - 172.55 |
0.9316 times |
Mon 30 June 2025 |
168.22 (3.52%) |
161.23 |
157.54 - 174.50 |
0.9692 times |
Fri 30 May 2025 |
162.50 (0.96%) |
163.54 |
142.80 - 168.62 |
1.2551 times |
Wed 30 April 2025 |
160.96 (-3.39%) |
166.27 |
133.70 - 171.56 |
1.0077 times |
Mon 31 March 2025 |
166.60 (-11.74%) |
188.99 |
159.29 - 194.88 |
0.8643 times |
Fri 28 February 2025 |
188.77 (8.35%) |
171.58 |
166.61 - 192.62 |
0.8073 times |
Fri 31 January 2025 |
174.23 (5.4%) |
167.33 |
163.54 - 183.14 |
0.9252 times |
Tue 31 December 2024 |
165.30 (-4.04%) |
170.41 |
165.17 - 180.97 |
0.6263 times |
DMA SMA EMA moving averages of Masimo Corporation MASI
DMA (daily moving average) of Masimo Corporation MASI
| DMA period | DMA value | | 5 day DMA | 147.4 | | 12 day DMA | 148.3 | | 20 day DMA | 146 | | 35 day DMA | 145.05 | | 50 day DMA | 145.58 | | 100 day DMA | 153.7 | | 150 day DMA | 155 | | 200 day DMA | 159.92 | EMA (exponential moving average) of Masimo Corporation MASI
| EMA period | EMA current | EMA prev | EMA prev2 | | 5 day EMA | 147.32 | 147.47 | 147.81 | | 12 day EMA | 147.21 | 147.25 | 147.33 | | 20 day EMA | 146.68 | 146.65 | 146.64 | | 35 day EMA | 146.42 | 146.38 | 146.36 | | 50 day EMA | 146.05 | 146.01 | 145.98 |
SMA (simple moving average) of Masimo Corporation MASI
| SMA period | SMA current | SMA prev | SMA prev2 | | 5 day SMA | 147.4 | 147.6 | 147.18 | | 12 day SMA | 148.3 | 148.17 | 147.82 | | 20 day SMA | 146 | 145.76 | 145.44 | | 35 day SMA | 145.05 | 144.84 | 144.64 | | 50 day SMA | 145.58 | 145.59 | 145.55 | | 100 day SMA | 153.7 | 153.8 | 153.84 | | 150 day SMA | 155 | 155.17 | 155.31 | | 200 day SMA | 159.92 | 160.04 | 160.15 |
|
|
