MarriottInternational MAR full analysis,charts,indicators,moving averages,SMA,DMA,EMA,ADX,MACD,RSIMarriott International MAR WideScreen charts, DMA,SMA,EMA technical analysis, forecast prediction, by indicators ADX,MACD,RSI,CCI USA stock exchange
operates under Consumer Services sector & deals in Hotels Resorts
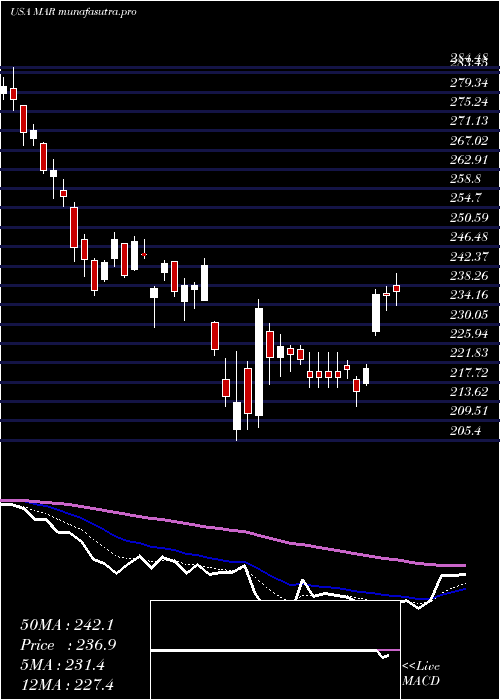
Daily price and charts and targets MarriottInternational Strong Daily Stock price targets for MarriottInternational MAR are 258.03 and 261.91 | Daily Target 1 | 257.37 | | Daily Target 2 | 258.68 | | Daily Target 3 | 261.24666666667 | | Daily Target 4 | 262.56 | | Daily Target 5 | 265.13 |
Daily price and volume Marriott International
| Date |
Closing |
Open |
Range |
Volume |
Mon 20 October 2025 |
260.00 (-0.33%) |
262.30 |
259.93 - 263.81 |
1.1181 times |
Fri 17 October 2025 |
260.85 (0.7%) |
259.00 |
258.62 - 263.07 |
1.1152 times |
Thu 16 October 2025 |
259.04 (-2.69%) |
267.38 |
257.92 - 267.72 |
0.9282 times |
Wed 15 October 2025 |
266.19 (-0.66%) |
267.80 |
263.44 - 269.79 |
0.8045 times |
Tue 14 October 2025 |
267.97 (1.79%) |
260.89 |
260.42 - 269.64 |
0.8847 times |
Mon 13 October 2025 |
263.26 (1.18%) |
263.61 |
261.32 - 265.29 |
0.9632 times |
Fri 10 October 2025 |
260.20 (-2.23%) |
266.33 |
259.86 - 270.22 |
1.1709 times |
Thu 09 October 2025 |
266.14 (-0.69%) |
268.18 |
265.93 - 272.85 |
0.8813 times |
Wed 08 October 2025 |
267.98 (0.2%) |
267.89 |
264.32 - 269.48 |
0.962 times |
Tue 07 October 2025 |
267.45 (-1.65%) |
272.43 |
265.53 - 273.04 |
1.1719 times |
Mon 06 October 2025 |
271.94 (1.63%) |
269.17 |
267.91 - 273.10 |
1.3989 times |
Weekly price and charts MarriottInternational Strong weekly Stock price targets for MarriottInternational MAR are 258.03 and 261.91 | Weekly Target 1 | 257.37 | | Weekly Target 2 | 258.68 | | Weekly Target 3 | 261.24666666667 | | Weekly Target 4 | 262.56 | | Weekly Target 5 | 265.13 |
Weekly price and volumes for Marriott International
| Date |
Closing |
Open |
Range |
Volume |
Mon 20 October 2025 |
260.00 (-0.33%) |
262.30 |
259.93 - 263.81 |
0.292 times |
Fri 17 October 2025 |
260.85 (0.25%) |
263.61 |
257.92 - 269.79 |
1.2263 times |
Fri 10 October 2025 |
260.20 (-2.75%) |
269.17 |
259.86 - 273.10 |
1.4586 times |
Fri 03 October 2025 |
267.57 (1.27%) |
265.40 |
258.07 - 268.95 |
1.341 times |
Fri 26 September 2025 |
264.21 (-1.61%) |
265.77 |
258.89 - 266.18 |
1.1166 times |
Fri 19 September 2025 |
268.52 (0.76%) |
267.25 |
260.15 - 270.28 |
1.5514 times |
Fri 12 September 2025 |
266.50 (0.68%) |
265.13 |
261.10 - 268.92 |
1.0342 times |
Fri 05 September 2025 |
264.70 (-1.18%) |
264.93 |
261.57 - 271.67 |
0.8989 times |
Fri 29 August 2025 |
267.86 (0%) |
269.10 |
266.19 - 270.38 |
0.152 times |
Fri 29 August 2025 |
267.86 (-2.18%) |
272.79 |
265.92 - 272.82 |
0.929 times |
Fri 22 August 2025 |
273.82 (3.25%) |
265.13 |
261.44 - 274.53 |
1.0374 times |
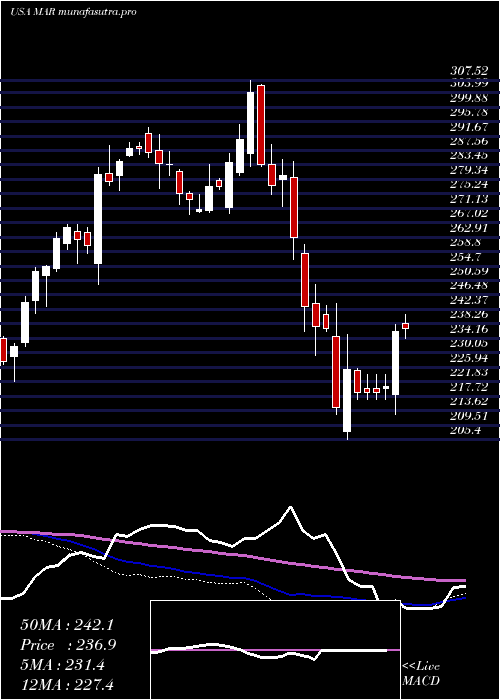
Monthly price and charts MarriottInternational Strong monthly Stock price targets for MarriottInternational MAR are 258.96 and 274.14 | Monthly Target 1 | 248.49 | | Monthly Target 2 | 254.25 | | Monthly Target 3 | 263.67333333333 | | Monthly Target 4 | 269.43 | | Monthly Target 5 | 278.85 |
Monthly price and volumes Marriott International
| Date |
Closing |
Open |
Range |
Volume |
Mon 20 October 2025 |
260.00 (-0.17%) |
258.37 |
257.92 - 273.10 |
0.6757 times |
Tue 30 September 2025 |
260.44 (-2.77%) |
264.93 |
258.89 - 271.67 |
0.9199 times |
Fri 29 August 2025 |
267.86 (1.53%) |
260.88 |
253.76 - 274.53 |
0.8601 times |
Thu 31 July 2025 |
263.83 (-3.43%) |
271.43 |
262.95 - 283.75 |
0.9005 times |
Mon 30 June 2025 |
273.21 (3.56%) |
262.12 |
253.56 - 275.80 |
0.9152 times |
Fri 30 May 2025 |
263.83 (10.58%) |
241.26 |
240.36 - 276.02 |
1.0214 times |
Wed 30 April 2025 |
238.58 (0.16%) |
237.48 |
205.40 - 244.02 |
1.4872 times |
Mon 31 March 2025 |
238.20 (-15.07%) |
280.00 |
229.38 - 284.48 |
1.1434 times |
Fri 28 February 2025 |
280.45 (-3.49%) |
286.79 |
271.70 - 307.52 |
1.0758 times |
Fri 31 January 2025 |
290.59 (4.18%) |
281.16 |
269.28 - 294.99 |
1.0006 times |
Tue 31 December 2024 |
278.94 (-3.21%) |
292.49 |
276.81 - 294.01 |
0.5407 times |

DMA SMA EMA moving averages of Marriott International MAR
DMA (daily moving average) of Marriott International MAR
| DMA period | DMA value | | 5 day DMA | 262.81 | | 12 day DMA | 264.88 | | 20 day DMA | 264.15 | | 35 day DMA | 264.76 | | 50 day DMA | 265.56 | | 100 day DMA | 267.12 | | 150 day DMA | 258.66 | | 200 day DMA | 263.7 | EMA (exponential moving average) of Marriott International MAR
| EMA period | EMA current | EMA prev | EMA prev2 | | 5 day EMA | 261.75 | 262.62 | 263.51 | | 12 day EMA | 263.38 | 263.99 | 264.56 | | 20 day EMA | 264 | 264.42 | 264.8 | | 35 day EMA | 264.5 | 264.77 | 265 | | 50 day EMA | 264.81 | 265.01 | 265.18 |
SMA (simple moving average) of Marriott International MAR
| SMA period | SMA current | SMA prev | SMA prev2 | | 5 day SMA | 262.81 | 263.46 | 263.33 | | 12 day SMA | 264.88 | 265.42 | 265.48 | | 20 day SMA | 264.15 | 264.36 | 264.74 | | 35 day SMA | 264.76 | 264.99 | 265.19 | | 50 day SMA | 265.56 | 265.52 | 265.5 | | 100 day SMA | 267.12 | 267.18 | 267.15 | | 150 day SMA | 258.66 | 258.51 | 258.39 | | 200 day SMA | 263.7 | 263.79 | 263.89 |
|
|
