MainStreet MAIN full analysis,charts,indicators,moving averages,SMA,DMA,EMA,ADX,MACD,RSIMain Street MAIN WideScreen charts, DMA,SMA,EMA technical analysis, forecast prediction, by indicators ADX,MACD,RSI,CCI USA stock exchange
operates under N A sector & deals in N A
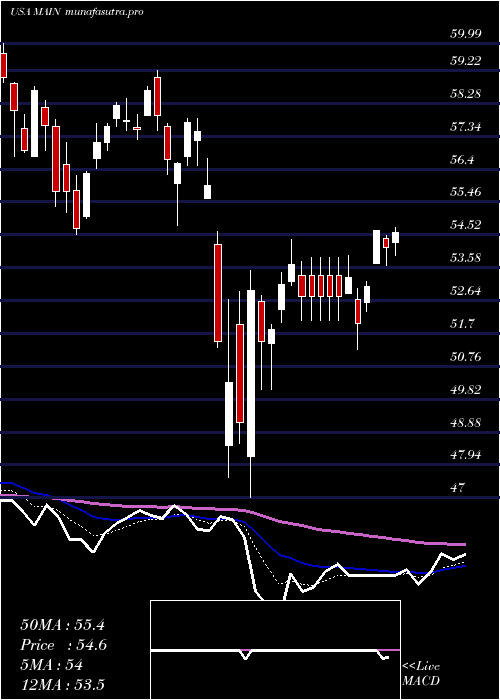
Daily price and charts and targets MainStreet Strong Daily Stock price targets for MainStreet MAIN are 59.59 and 60.55 | Daily Target 1 | 58.81 | | Daily Target 2 | 59.4 | | Daily Target 3 | 59.773333333333 | | Daily Target 4 | 60.36 | | Daily Target 5 | 60.73 |
Daily price and volume Main Street
| Date |
Closing |
Open |
Range |
Volume |
Thu 04 December 2025 |
59.98 (1.06%) |
59.60 |
59.19 - 60.15 |
1.206 times |
Wed 03 December 2025 |
59.35 (2.22%) |
58.30 |
58.18 - 59.36 |
1.0043 times |
Tue 02 December 2025 |
58.06 (0.24%) |
58.00 |
57.57 - 58.37 |
0.8371 times |
Mon 01 December 2025 |
57.92 (-0.21%) |
57.82 |
57.70 - 58.45 |
0.8492 times |
Fri 28 November 2025 |
58.04 (0.61%) |
58.00 |
57.81 - 58.18 |
0.428 times |
Wed 26 November 2025 |
57.69 (0.91%) |
57.20 |
57.19 - 57.90 |
0.6759 times |
Tue 25 November 2025 |
57.17 (1.38%) |
56.56 |
56.40 - 57.22 |
0.8509 times |
Mon 24 November 2025 |
56.39 (1.49%) |
55.56 |
55.25 - 56.63 |
0.9303 times |
Fri 21 November 2025 |
55.56 (0.09%) |
55.58 |
54.85 - 56.25 |
1.8533 times |
Thu 20 November 2025 |
55.51 (-1.54%) |
56.72 |
55.14 - 56.99 |
1.3649 times |
Wed 19 November 2025 |
56.38 (-1.14%) |
56.91 |
56.17 - 57.26 |
1.3183 times |
Weekly price and charts MainStreet Strong weekly Stock price targets for MainStreet MAIN are 58.78 and 61.36 | Weekly Target 1 | 56.65 | | Weekly Target 2 | 58.32 | | Weekly Target 3 | 59.233333333333 | | Weekly Target 4 | 60.9 | | Weekly Target 5 | 61.81 |
Weekly price and volumes for Main Street
| Date |
Closing |
Open |
Range |
Volume |
Thu 04 December 2025 |
59.98 (3.34%) |
57.82 |
57.57 - 60.15 |
0.8519 times |
Fri 28 November 2025 |
58.04 (4.46%) |
55.56 |
55.25 - 58.18 |
0.6307 times |
Fri 21 November 2025 |
55.56 (-4.9%) |
58.48 |
54.85 - 58.63 |
1.4832 times |
Fri 14 November 2025 |
58.42 (-0.48%) |
58.87 |
57.81 - 59.58 |
1.0832 times |
Fri 07 November 2025 |
58.70 (3.13%) |
56.89 |
56.12 - 58.88 |
0.9587 times |
Fri 31 October 2025 |
56.92 (0%) |
56.15 |
55.86 - 57.38 |
0.2317 times |
Fri 31 October 2025 |
56.92 (-0.92%) |
57.45 |
55.86 - 58.95 |
1.1553 times |
Fri 24 October 2025 |
57.45 (-1.19%) |
58.27 |
57.00 - 58.56 |
1.2335 times |
Fri 17 October 2025 |
58.14 (-5.88%) |
56.06 |
55.68 - 59.00 |
1.8114 times |
Tue 07 October 2025 |
61.77 (-1.89%) |
63.32 |
61.01 - 63.35 |
0.5605 times |
Fri 03 October 2025 |
62.96 (-1.24%) |
64.00 |
62.00 - 64.39 |
0.965 times |
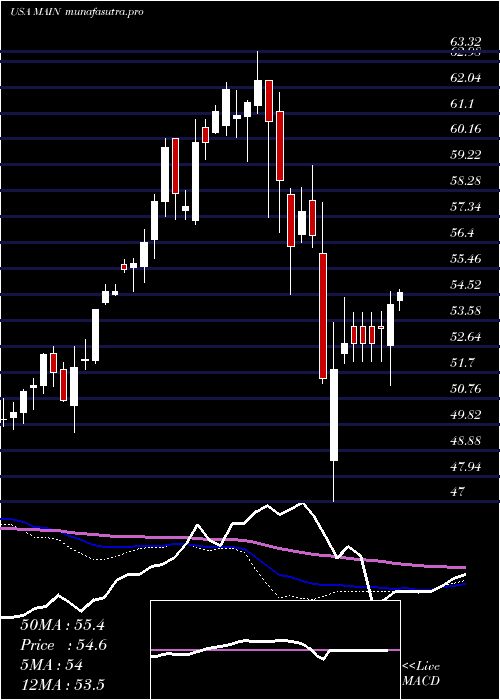
Monthly price and charts MainStreet Strong monthly Stock price targets for MainStreet MAIN are 58.78 and 61.36 | Monthly Target 1 | 56.65 | | Monthly Target 2 | 58.32 | | Monthly Target 3 | 59.233333333333 | | Monthly Target 4 | 60.9 | | Monthly Target 5 | 61.81 |
Monthly price and volumes Main Street
| Date |
Closing |
Open |
Range |
Volume |
Thu 04 December 2025 |
59.98 (3.34%) |
57.82 |
57.57 - 60.15 |
0.1663 times |
Fri 28 November 2025 |
58.04 (1.97%) |
56.89 |
54.85 - 59.58 |
0.8114 times |
Fri 31 October 2025 |
56.92 (-10.49%) |
63.50 |
55.68 - 64.21 |
1.0885 times |
Tue 30 September 2025 |
63.59 (-4.07%) |
65.75 |
62.20 - 67.34 |
1.222 times |
Fri 29 August 2025 |
66.29 (2.46%) |
64.16 |
62.92 - 67.77 |
1.1045 times |
Thu 31 July 2025 |
64.70 (9.48%) |
59.00 |
58.85 - 66.39 |
1.0293 times |
Mon 30 June 2025 |
59.10 (3.9%) |
56.70 |
55.61 - 59.70 |
0.8549 times |
Fri 30 May 2025 |
56.88 (6.2%) |
53.69 |
51.44 - 57.36 |
1.4113 times |
Wed 30 April 2025 |
53.56 (-5.3%) |
56.77 |
47.00 - 57.84 |
1.1433 times |
Mon 31 March 2025 |
56.56 (-6.97%) |
61.14 |
54.53 - 61.85 |
1.1687 times |
Fri 28 February 2025 |
60.80 (-1.87%) |
60.89 |
57.30 - 63.32 |
1.0249 times |

DMA SMA EMA moving averages of Main Street MAIN
DMA (daily moving average) of Main Street MAIN
| DMA period | DMA value | | 5 day DMA | 58.67 | | 12 day DMA | 57.42 | | 20 day DMA | 57.82 | | 35 day DMA | 57.7 | | 50 day DMA | 59.05 | | 100 day DMA | 62.19 | | 150 day DMA | 60.37 | | 200 day DMA | 59.38 | EMA (exponential moving average) of Main Street MAIN
| EMA period | EMA current | EMA prev | EMA prev2 | | 5 day EMA | 58.83 | 58.26 | 57.71 | | 12 day EMA | 58.11 | 57.77 | 57.48 | | 20 day EMA | 58.03 | 57.83 | 57.67 | | 35 day EMA | 58.76 | 58.69 | 58.65 | | 50 day EMA | 59.55 | 59.53 | 59.54 |
SMA (simple moving average) of Main Street MAIN
| SMA period | SMA current | SMA prev | SMA prev2 | | 5 day SMA | 58.67 | 58.21 | 57.78 | | 12 day SMA | 57.42 | 57.19 | 57.11 | | 20 day SMA | 57.82 | 57.68 | 57.57 | | 35 day SMA | 57.7 | 57.64 | 57.62 | | 50 day SMA | 59.05 | 59.17 | 59.3 | | 100 day SMA | 62.19 | 62.21 | 62.23 | | 150 day SMA | 60.37 | 60.34 | 60.3 | | 200 day SMA | 59.38 | 59.38 | 59.39 |
|
|
