MacerichCompany MAC full analysis,charts,indicators,moving averages,SMA,DMA,EMA,ADX,MACD,RSIMacerich Company MAC WideScreen charts, DMA,SMA,EMA technical analysis, forecast prediction, by indicators ADX,MACD,RSI,CCI USA stock exchange
operates under Consumer Services sector & deals in Real Estate Investment Trusts
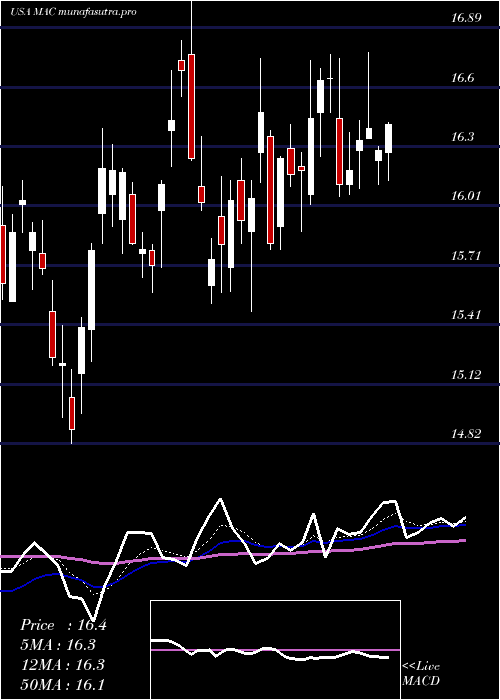
Daily price and charts and targets MacerichCompany Strong Daily Stock price targets for MacerichCompany MAC are 16.89 and 17.3 | Daily Target 1 | 16.79 | | Daily Target 2 | 16.98 | | Daily Target 3 | 17.203333333333 | | Daily Target 4 | 17.39 | | Daily Target 5 | 17.61 |
Daily price and volume Macerich Company
| Date |
Closing |
Open |
Range |
Volume |
Mon 20 October 2025 |
17.16 (-0.46%) |
17.33 |
17.02 - 17.43 |
0.8265 times |
Fri 17 October 2025 |
17.24 (1.29%) |
16.92 |
16.84 - 17.29 |
0.6995 times |
Thu 16 October 2025 |
17.02 (-1.85%) |
17.29 |
16.89 - 17.42 |
0.8258 times |
Wed 15 October 2025 |
17.34 (1.29%) |
17.25 |
17.03 - 17.45 |
1.6069 times |
Tue 14 October 2025 |
17.12 (2.27%) |
16.52 |
16.44 - 17.25 |
1.6707 times |
Mon 13 October 2025 |
16.74 (1.52%) |
16.73 |
16.60 - 16.82 |
0.9339 times |
Fri 10 October 2025 |
16.49 (-3.34%) |
17.10 |
16.49 - 17.18 |
1.3964 times |
Thu 09 October 2025 |
17.06 (-0.76%) |
17.19 |
16.89 - 17.19 |
0.5344 times |
Wed 08 October 2025 |
17.19 (-1.15%) |
17.32 |
17.08 - 17.41 |
0.5997 times |
Tue 07 October 2025 |
17.39 (-2.3%) |
17.73 |
17.26 - 17.73 |
0.9061 times |
Mon 06 October 2025 |
17.80 (-1.33%) |
18.01 |
17.74 - 18.24 |
0.8345 times |
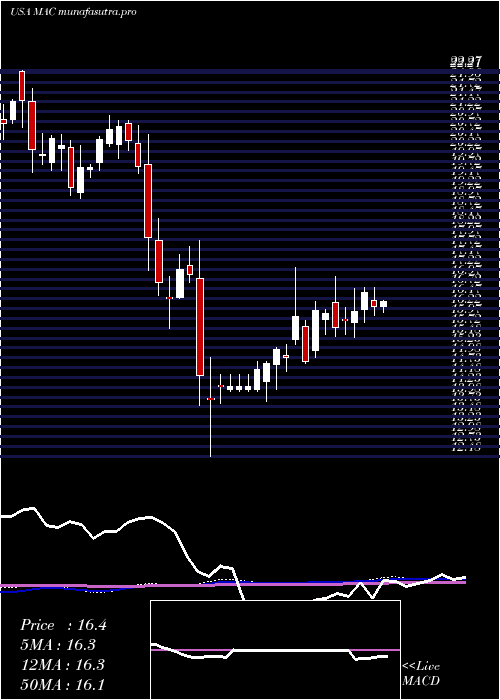
Weekly price and charts MacerichCompany Strong weekly Stock price targets for MacerichCompany MAC are 16.89 and 17.3 | Weekly Target 1 | 16.79 | | Weekly Target 2 | 16.98 | | Weekly Target 3 | 17.203333333333 | | Weekly Target 4 | 17.39 | | Weekly Target 5 | 17.61 |
Weekly price and volumes for Macerich Company
| Date |
Closing |
Open |
Range |
Volume |
Mon 20 October 2025 |
17.16 (-0.46%) |
17.33 |
17.02 - 17.43 |
0.1809 times |
Fri 17 October 2025 |
17.24 (4.55%) |
16.73 |
16.44 - 17.45 |
1.2559 times |
Fri 10 October 2025 |
16.49 (-8.59%) |
18.01 |
16.49 - 18.24 |
0.935 times |
Fri 03 October 2025 |
18.04 (0.78%) |
18.00 |
17.51 - 18.31 |
1.6141 times |
Fri 26 September 2025 |
17.90 (2.64%) |
17.46 |
16.54 - 18.07 |
1.7385 times |
Fri 19 September 2025 |
17.44 (-3.86%) |
18.17 |
17.38 - 18.37 |
1.4405 times |
Fri 12 September 2025 |
18.14 (-3.25%) |
18.39 |
17.78 - 18.70 |
1.1162 times |
Fri 05 September 2025 |
18.75 (1.9%) |
17.99 |
17.83 - 18.94 |
0.6709 times |
Fri 29 August 2025 |
18.40 (0%) |
18.48 |
18.28 - 18.65 |
0.1281 times |
Fri 29 August 2025 |
18.40 (1.55%) |
18.10 |
17.93 - 18.65 |
0.9198 times |
Fri 22 August 2025 |
18.12 (5.29%) |
17.18 |
17.02 - 18.21 |
0.8668 times |
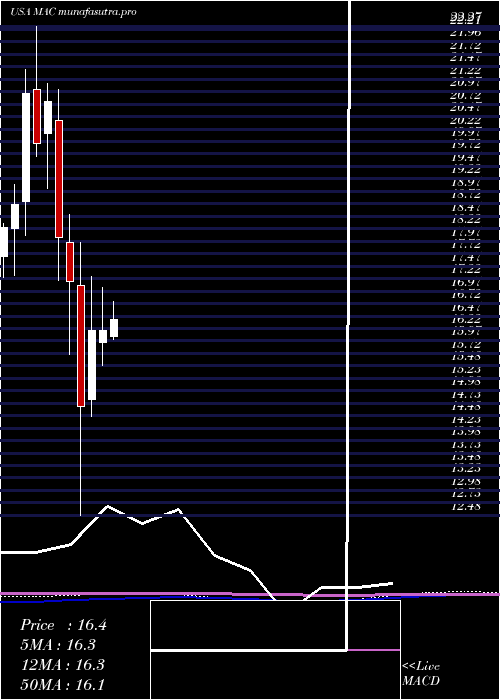
Monthly price and charts MacerichCompany Strong monthly Stock price targets for MacerichCompany MAC are 15.87 and 17.74 | Monthly Target 1 | 15.43 | | Monthly Target 2 | 16.3 | | Monthly Target 3 | 17.303333333333 | | Monthly Target 4 | 18.17 | | Monthly Target 5 | 19.17 |
Monthly price and volumes Macerich Company
| Date |
Closing |
Open |
Range |
Volume |
Mon 20 October 2025 |
17.16 (-5.71%) |
18.04 |
16.44 - 18.31 |
0.6695 times |
Tue 30 September 2025 |
18.20 (-1.09%) |
17.99 |
16.54 - 18.94 |
1.2125 times |
Fri 29 August 2025 |
18.40 (10.11%) |
16.48 |
15.94 - 18.65 |
0.9188 times |
Thu 31 July 2025 |
16.71 (3.28%) |
16.06 |
15.89 - 17.92 |
0.8727 times |
Mon 30 June 2025 |
16.18 (0%) |
15.94 |
15.48 - 17.04 |
0.8244 times |
Fri 30 May 2025 |
16.18 (10.37%) |
14.80 |
14.46 - 17.27 |
1.0027 times |
Wed 30 April 2025 |
14.66 (-14.62%) |
17.09 |
12.48 - 17.94 |
1.2675 times |
Mon 31 March 2025 |
17.17 (-4.82%) |
17.95 |
15.71 - 18.51 |
1.3465 times |
Fri 28 February 2025 |
18.04 (-13.19%) |
20.38 |
17.18 - 21.00 |
0.9312 times |
Fri 31 January 2025 |
20.78 (4.32%) |
20.12 |
19.02 - 21.12 |
0.9541 times |
Tue 31 December 2024 |
19.92 (-4.83%) |
21.02 |
19.67 - 22.27 |
0.8386 times |
DMA SMA EMA moving averages of Macerich Company MAC
DMA (daily moving average) of Macerich Company MAC
| DMA period | DMA value | | 5 day DMA | 17.18 | | 12 day DMA | 17.22 | | 20 day DMA | 17.34 | | 35 day DMA | 17.65 | | 50 day DMA | 17.69 | | 100 day DMA | 17.06 | | 150 day DMA | 16.49 | | 200 day DMA | 17.24 | EMA (exponential moving average) of Macerich Company MAC
| EMA period | EMA current | EMA prev | EMA prev2 | | 5 day EMA | 17.15 | 17.14 | 17.09 | | 12 day EMA | 17.22 | 17.23 | 17.23 | | 20 day EMA | 17.32 | 17.34 | 17.35 | | 35 day EMA | 17.44 | 17.46 | 17.47 | | 50 day EMA | 17.57 | 17.59 | 17.6 |
SMA (simple moving average) of Macerich Company MAC
| SMA period | SMA current | SMA prev | SMA prev2 | | 5 day SMA | 17.18 | 17.09 | 16.94 | | 12 day SMA | 17.22 | 17.28 | 17.34 | | 20 day SMA | 17.34 | 17.34 | 17.35 | | 35 day SMA | 17.65 | 17.68 | 17.71 | | 50 day SMA | 17.69 | 17.68 | 17.67 | | 100 day SMA | 17.06 | 17.04 | 17.02 | | 150 day SMA | 16.49 | 16.49 | 16.49 | | 200 day SMA | 17.24 | 17.25 | 17.27 |
|
|
