LiveNation LYV full analysis,charts,indicators,moving averages,SMA,DMA,EMA,ADX,MACD,RSILive Nation LYV WideScreen charts, DMA,SMA,EMA technical analysis, forecast prediction, by indicators ADX,MACD,RSI,CCI USA stock exchange
operates under Consumer Services sector & deals in Services Misc Amusement Recreation
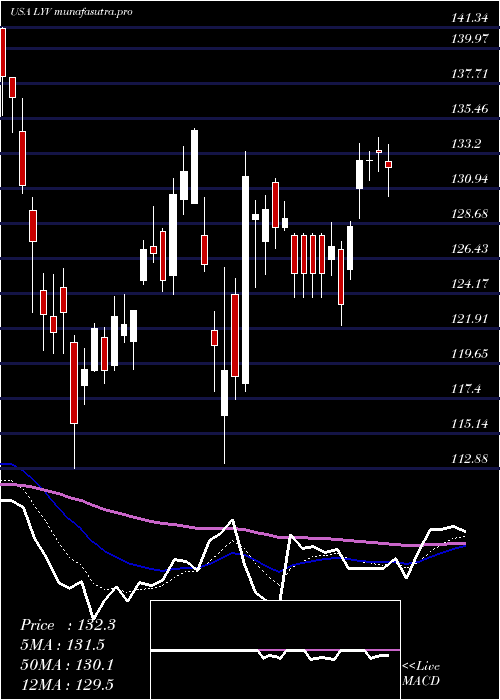
Daily price and charts and targets LiveNation Strong Daily Stock price targets for LiveNation LYV are 137.51 and 142.05 | Daily Target 1 | 133.76 | | Daily Target 2 | 136.72 | | Daily Target 3 | 138.3 | | Daily Target 4 | 141.26 | | Daily Target 5 | 142.84 |
Daily price and volume Live Nation
| Date |
Closing |
Open |
Range |
Volume |
Thu 04 December 2025 |
139.68 (2.7%) |
136.54 |
135.34 - 139.88 |
1.2586 times |
Wed 03 December 2025 |
136.01 (5.81%) |
128.93 |
128.65 - 136.46 |
1.5521 times |
Tue 02 December 2025 |
128.54 (-1.95%) |
131.10 |
128.50 - 131.50 |
0.7837 times |
Mon 01 December 2025 |
131.10 (-0.27%) |
130.78 |
129.71 - 132.35 |
0.5784 times |
Fri 28 November 2025 |
131.45 (0.31%) |
130.50 |
130.24 - 132.15 |
0.2855 times |
Wed 26 November 2025 |
131.05 (1.15%) |
129.73 |
129.72 - 132.13 |
0.8429 times |
Tue 25 November 2025 |
129.56 (3.14%) |
127.98 |
125.34 - 130.02 |
1.3564 times |
Mon 24 November 2025 |
125.61 (-3.84%) |
130.42 |
125.44 - 130.60 |
1.5208 times |
Fri 21 November 2025 |
130.63 (1.26%) |
129.13 |
128.40 - 132.11 |
0.8347 times |
Thu 20 November 2025 |
129.01 (-0.76%) |
130.58 |
128.39 - 132.27 |
0.9869 times |
Wed 19 November 2025 |
130.00 (-1.01%) |
131.71 |
128.96 - 132.00 |
0.8912 times |
Weekly price and charts LiveNation Strong weekly Stock price targets for LiveNation LYV are 134.09 and 145.47 | Weekly Target 1 | 124.64 | | Weekly Target 2 | 132.16 | | Weekly Target 3 | 136.02 | | Weekly Target 4 | 143.54 | | Weekly Target 5 | 147.4 |
Weekly price and volumes for Live Nation
| Date |
Closing |
Open |
Range |
Volume |
Thu 04 December 2025 |
139.68 (6.26%) |
130.78 |
128.50 - 139.88 |
1.1797 times |
Fri 28 November 2025 |
131.45 (0.63%) |
130.42 |
125.34 - 132.15 |
1.1324 times |
Fri 21 November 2025 |
130.63 (-3.85%) |
135.43 |
128.39 - 135.95 |
1.4483 times |
Fri 14 November 2025 |
135.86 (-3.31%) |
140.48 |
135.14 - 144.76 |
1.3178 times |
Fri 07 November 2025 |
140.51 (-6.03%) |
146.59 |
133.54 - 152.61 |
1.703 times |
Fri 31 October 2025 |
149.53 (0%) |
148.09 |
147.46 - 151.14 |
0.2427 times |
Fri 31 October 2025 |
149.53 (-2.18%) |
153.91 |
147.39 - 154.19 |
0.9426 times |
Fri 24 October 2025 |
152.86 (-1.5%) |
155.43 |
152.51 - 159.19 |
0.7073 times |
Fri 17 October 2025 |
155.19 (-0.09%) |
153.93 |
150.79 - 156.71 |
1.0223 times |
Tue 07 October 2025 |
155.33 (-0.63%) |
156.70 |
153.01 - 156.70 |
0.304 times |
Fri 03 October 2025 |
156.32 (-3.38%) |
162.93 |
152.93 - 168.11 |
1.4263 times |
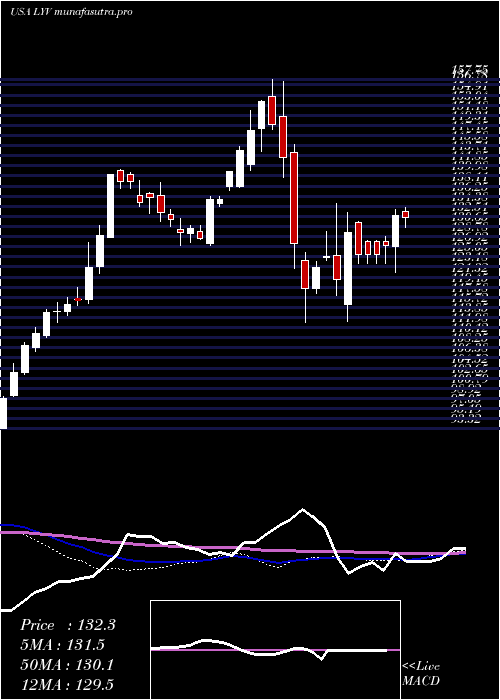
Monthly price and charts LiveNation Strong monthly Stock price targets for LiveNation LYV are 134.09 and 145.47 | Monthly Target 1 | 124.64 | | Monthly Target 2 | 132.16 | | Monthly Target 3 | 136.02 | | Monthly Target 4 | 143.54 | | Monthly Target 5 | 147.4 |
Monthly price and volumes Live Nation
| Date |
Closing |
Open |
Range |
Volume |
Thu 04 December 2025 |
139.68 (6.26%) |
130.78 |
128.50 - 139.88 |
0.2828 times |
Fri 28 November 2025 |
131.45 (-12.09%) |
146.59 |
125.34 - 152.61 |
1.3426 times |
Fri 31 October 2025 |
149.53 (-8.49%) |
161.00 |
147.39 - 161.97 |
0.9201 times |
Tue 30 September 2025 |
163.40 (-1.86%) |
164.30 |
159.95 - 175.25 |
1.1512 times |
Fri 29 August 2025 |
166.49 (12.72%) |
146.03 |
143.25 - 167.22 |
0.8796 times |
Thu 31 July 2025 |
147.70 (-2.37%) |
150.72 |
142.24 - 155.07 |
0.8706 times |
Mon 30 June 2025 |
151.28 (10.27%) |
136.91 |
134.85 - 151.80 |
1.2228 times |
Fri 30 May 2025 |
137.19 (3.58%) |
133.38 |
128.70 - 148.46 |
1.1602 times |
Wed 30 April 2025 |
132.45 (1.43%) |
130.25 |
113.20 - 134.83 |
0.9888 times |
Mon 31 March 2025 |
130.58 (-8.91%) |
144.27 |
112.88 - 145.79 |
1.1813 times |
Fri 28 February 2025 |
143.36 (-0.91%) |
142.07 |
139.67 - 157.75 |
1.0458 times |

DMA SMA EMA moving averages of Live Nation LYV
DMA (daily moving average) of Live Nation LYV
| DMA period | DMA value | | 5 day DMA | 133.36 | | 12 day DMA | 131.16 | | 20 day DMA | 134.15 | | 35 day DMA | 141.5 | | 50 day DMA | 146.79 | | 100 day DMA | 152.98 | | 150 day DMA | 149.46 | | 200 day DMA | 145.02 | EMA (exponential moving average) of Live Nation LYV
| EMA period | EMA current | EMA prev | EMA prev2 | | 5 day EMA | 134.55 | 131.99 | 129.98 | | 12 day EMA | 133.62 | 132.52 | 131.89 | | 20 day EMA | 135.7 | 135.28 | 135.2 | | 35 day EMA | 140.95 | 141.02 | 141.31 | | 50 day EMA | 147.23 | 147.54 | 148.01 |
SMA (simple moving average) of Live Nation LYV
| SMA period | SMA current | SMA prev | SMA prev2 | | 5 day SMA | 133.36 | 131.63 | 130.34 | | 12 day SMA | 131.16 | 130.56 | 130.55 | | 20 day SMA | 134.15 | 133.91 | 134.64 | | 35 day SMA | 141.5 | 141.94 | 142.42 | | 50 day SMA | 146.79 | 147.27 | 147.84 | | 100 day SMA | 152.98 | 153.03 | 153.11 | | 150 day SMA | 149.46 | 149.41 | 149.39 | | 200 day SMA | 145.02 | 145.07 | 145.12 |
|
|
