LsiIndustries LYTS full analysis,charts,indicators,moving averages,SMA,DMA,EMA,ADX,MACD,RSILsi Industries LYTS WideScreen charts, DMA,SMA,EMA technical analysis, forecast prediction, by indicators ADX,MACD,RSI,CCI USA stock exchange
operates under Consumer Durables sector & deals in Building Products
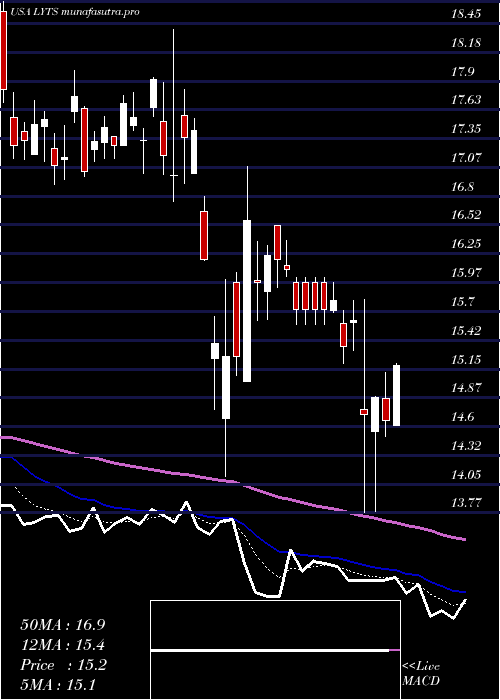
Daily price and charts and targets LsiIndustries Strong Daily Stock price targets for LsiIndustries LYTS are 18.58 and 19.15 | Daily Target 1 | 18.15 | | Daily Target 2 | 18.44 | | Daily Target 3 | 18.723333333333 | | Daily Target 4 | 19.01 | | Daily Target 5 | 19.29 |
Daily price and volume Lsi Industries
| Date |
Closing |
Open |
Range |
Volume |
Thu 04 December 2025 |
18.72 (1.19%) |
18.44 |
18.44 - 19.01 |
0.7263 times |
Wed 03 December 2025 |
18.50 (2.38%) |
18.14 |
17.89 - 18.58 |
0.891 times |
Tue 02 December 2025 |
18.07 (0.5%) |
18.16 |
18.05 - 18.29 |
0.6818 times |
Mon 01 December 2025 |
17.98 (-1.69%) |
18.02 |
17.79 - 18.44 |
0.7386 times |
Fri 28 November 2025 |
18.29 (-0.05%) |
18.44 |
18.02 - 18.60 |
0.5492 times |
Wed 26 November 2025 |
18.30 (0.66%) |
18.10 |
17.99 - 18.40 |
0.593 times |
Tue 25 November 2025 |
18.18 (1.22%) |
18.10 |
17.97 - 18.43 |
0.8318 times |
Mon 24 November 2025 |
17.96 (-0.99%) |
18.09 |
17.81 - 18.29 |
0.9749 times |
Fri 21 November 2025 |
18.14 (4.13%) |
17.37 |
17.37 - 18.54 |
2.0455 times |
Thu 20 November 2025 |
17.42 (0.99%) |
17.59 |
17.30 - 17.86 |
1.9678 times |
Wed 19 November 2025 |
17.25 (-0.29%) |
17.40 |
17.21 - 17.58 |
1.0107 times |
Weekly price and charts LsiIndustries Strong weekly Stock price targets for LsiIndustries LYTS are 18.26 and 19.48 | Weekly Target 1 | 17.29 | | Weekly Target 2 | 18 | | Weekly Target 3 | 18.506666666667 | | Weekly Target 4 | 19.22 | | Weekly Target 5 | 19.73 |
Weekly price and volumes for Lsi Industries
| Date |
Closing |
Open |
Range |
Volume |
Thu 04 December 2025 |
18.72 (2.35%) |
18.02 |
17.79 - 19.01 |
0.7019 times |
Fri 28 November 2025 |
18.29 (0.83%) |
18.09 |
17.81 - 18.60 |
0.6814 times |
Fri 21 November 2025 |
18.14 (-1.41%) |
18.36 |
17.21 - 18.54 |
1.7426 times |
Fri 14 November 2025 |
18.40 (-5.35%) |
19.45 |
18.06 - 20.41 |
1.5919 times |
Fri 07 November 2025 |
19.44 (-15.07%) |
22.99 |
19.23 - 23.12 |
1.4158 times |
Fri 31 October 2025 |
22.89 (0%) |
22.95 |
22.61 - 23.10 |
0.2491 times |
Fri 31 October 2025 |
22.89 (-3.3%) |
23.78 |
22.61 - 23.93 |
0.9138 times |
Fri 24 October 2025 |
23.67 (6.96%) |
22.34 |
22.22 - 23.92 |
0.7618 times |
Fri 17 October 2025 |
22.13 (2.22%) |
21.95 |
21.55 - 23.22 |
0.9896 times |
Fri 10 October 2025 |
21.65 (-6.36%) |
23.36 |
21.58 - 23.48 |
0.952 times |
Fri 03 October 2025 |
23.12 (-2.41%) |
23.83 |
22.85 - 23.90 |
1.0699 times |
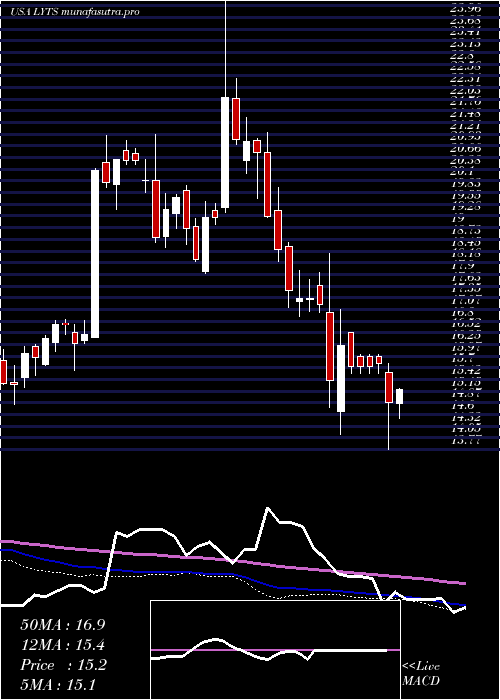
Monthly price and charts LsiIndustries Strong monthly Stock price targets for LsiIndustries LYTS are 18.26 and 19.48 | Monthly Target 1 | 17.29 | | Monthly Target 2 | 18 | | Monthly Target 3 | 18.506666666667 | | Monthly Target 4 | 19.22 | | Monthly Target 5 | 19.73 |
Monthly price and volumes Lsi Industries
| Date |
Closing |
Open |
Range |
Volume |
Thu 04 December 2025 |
18.72 (2.35%) |
18.02 |
17.79 - 19.01 |
0.1672 times |
Fri 28 November 2025 |
18.29 (-20.1%) |
22.99 |
17.21 - 23.12 |
1.2938 times |
Fri 31 October 2025 |
22.89 (-3.05%) |
23.52 |
21.55 - 23.93 |
1.0455 times |
Tue 30 September 2025 |
23.61 (2.97%) |
22.44 |
21.90 - 24.16 |
1.6429 times |
Fri 29 August 2025 |
22.93 (25.3%) |
17.91 |
17.65 - 23.75 |
1.4666 times |
Thu 31 July 2025 |
18.30 (7.58%) |
16.94 |
16.92 - 19.15 |
0.6519 times |
Mon 30 June 2025 |
17.01 (4.55%) |
16.20 |
15.92 - 17.35 |
0.7397 times |
Fri 30 May 2025 |
16.27 (7.82%) |
15.10 |
15.08 - 17.09 |
0.7789 times |
Wed 30 April 2025 |
15.09 (-11.24%) |
17.57 |
13.77 - 17.82 |
1.2835 times |
Mon 31 March 2025 |
17.00 (-8.06%) |
18.57 |
16.75 - 18.66 |
0.93 times |
Fri 28 February 2025 |
18.49 (-12.24%) |
20.59 |
18.21 - 21.60 |
0.8808 times |

DMA SMA EMA moving averages of Lsi Industries LYTS
DMA (daily moving average) of Lsi Industries LYTS
| DMA period | DMA value | | 5 day DMA | 18.31 | | 12 day DMA | 18.01 | | 20 day DMA | 18.4 | | 35 day DMA | 20.39 | | 50 day DMA | 21.12 | | 100 day DMA | 20.91 | | 150 day DMA | 19.44 | | 200 day DMA | 18.83 | EMA (exponential moving average) of Lsi Industries LYTS
| EMA period | EMA current | EMA prev | EMA prev2 | | 5 day EMA | 18.39 | 18.23 | 18.09 | | 12 day EMA | 18.42 | 18.37 | 18.35 | | 20 day EMA | 18.91 | 18.93 | 18.97 | | 35 day EMA | 19.81 | 19.87 | 19.95 | | 50 day EMA | 21.03 | 21.12 | 21.23 |
SMA (simple moving average) of Lsi Industries LYTS
| SMA period | SMA current | SMA prev | SMA prev2 | | 5 day SMA | 18.31 | 18.23 | 18.16 | | 12 day SMA | 18.01 | 17.92 | 17.91 | | 20 day SMA | 18.4 | 18.62 | 18.83 | | 35 day SMA | 20.39 | 20.5 | 20.62 | | 50 day SMA | 21.12 | 21.21 | 21.31 | | 100 day SMA | 20.91 | 20.89 | 20.88 | | 150 day SMA | 19.44 | 19.41 | 19.39 | | 200 day SMA | 18.83 | 18.84 | 18.84 |
|
|
